Now feels like a good time for reflection. Large language models are getting better and better (despite the naysayers), and it is inevitable that the way of working in science will change. At the same time, the US government is drastically cutting science funding, creating a lot of uncertainty. It’s never been lost on me that so much of my undergrad through current post-doctoral position (my entire ‘early career’) is the result of a societal choice to value basic science research, and this valuation is fundamentally changing.
So with this in mind, I will write a blog post describing my experience in science so far and the threads connecting it.
Streamflow in unmonitored watersheds
I grew up in the Piedmont region of North Carolina. Our family picked up whitewater kayaking when I was a teenager, and I was completely hooked. One of my favorite rivers was the Wild and Scenic Wilson Creek.
As you can see in the photo below, the river is normally quite rocky and slow moving. To be fun for whitewater kayaks, the river needs a day or two of decent rain to rise sufficiently. I became fascinated by streamflow, for both Wilson Creek and the other rivers of Western North Carolina. I was interested in a few factors— for one, not all rivers create good or navigable whitewater. It seemed like both the geology and climate were important for making the natural features that can produce stunning shapes of navigable rapids. I learned a few lessons about hydrology from paddling Wilson Creek.
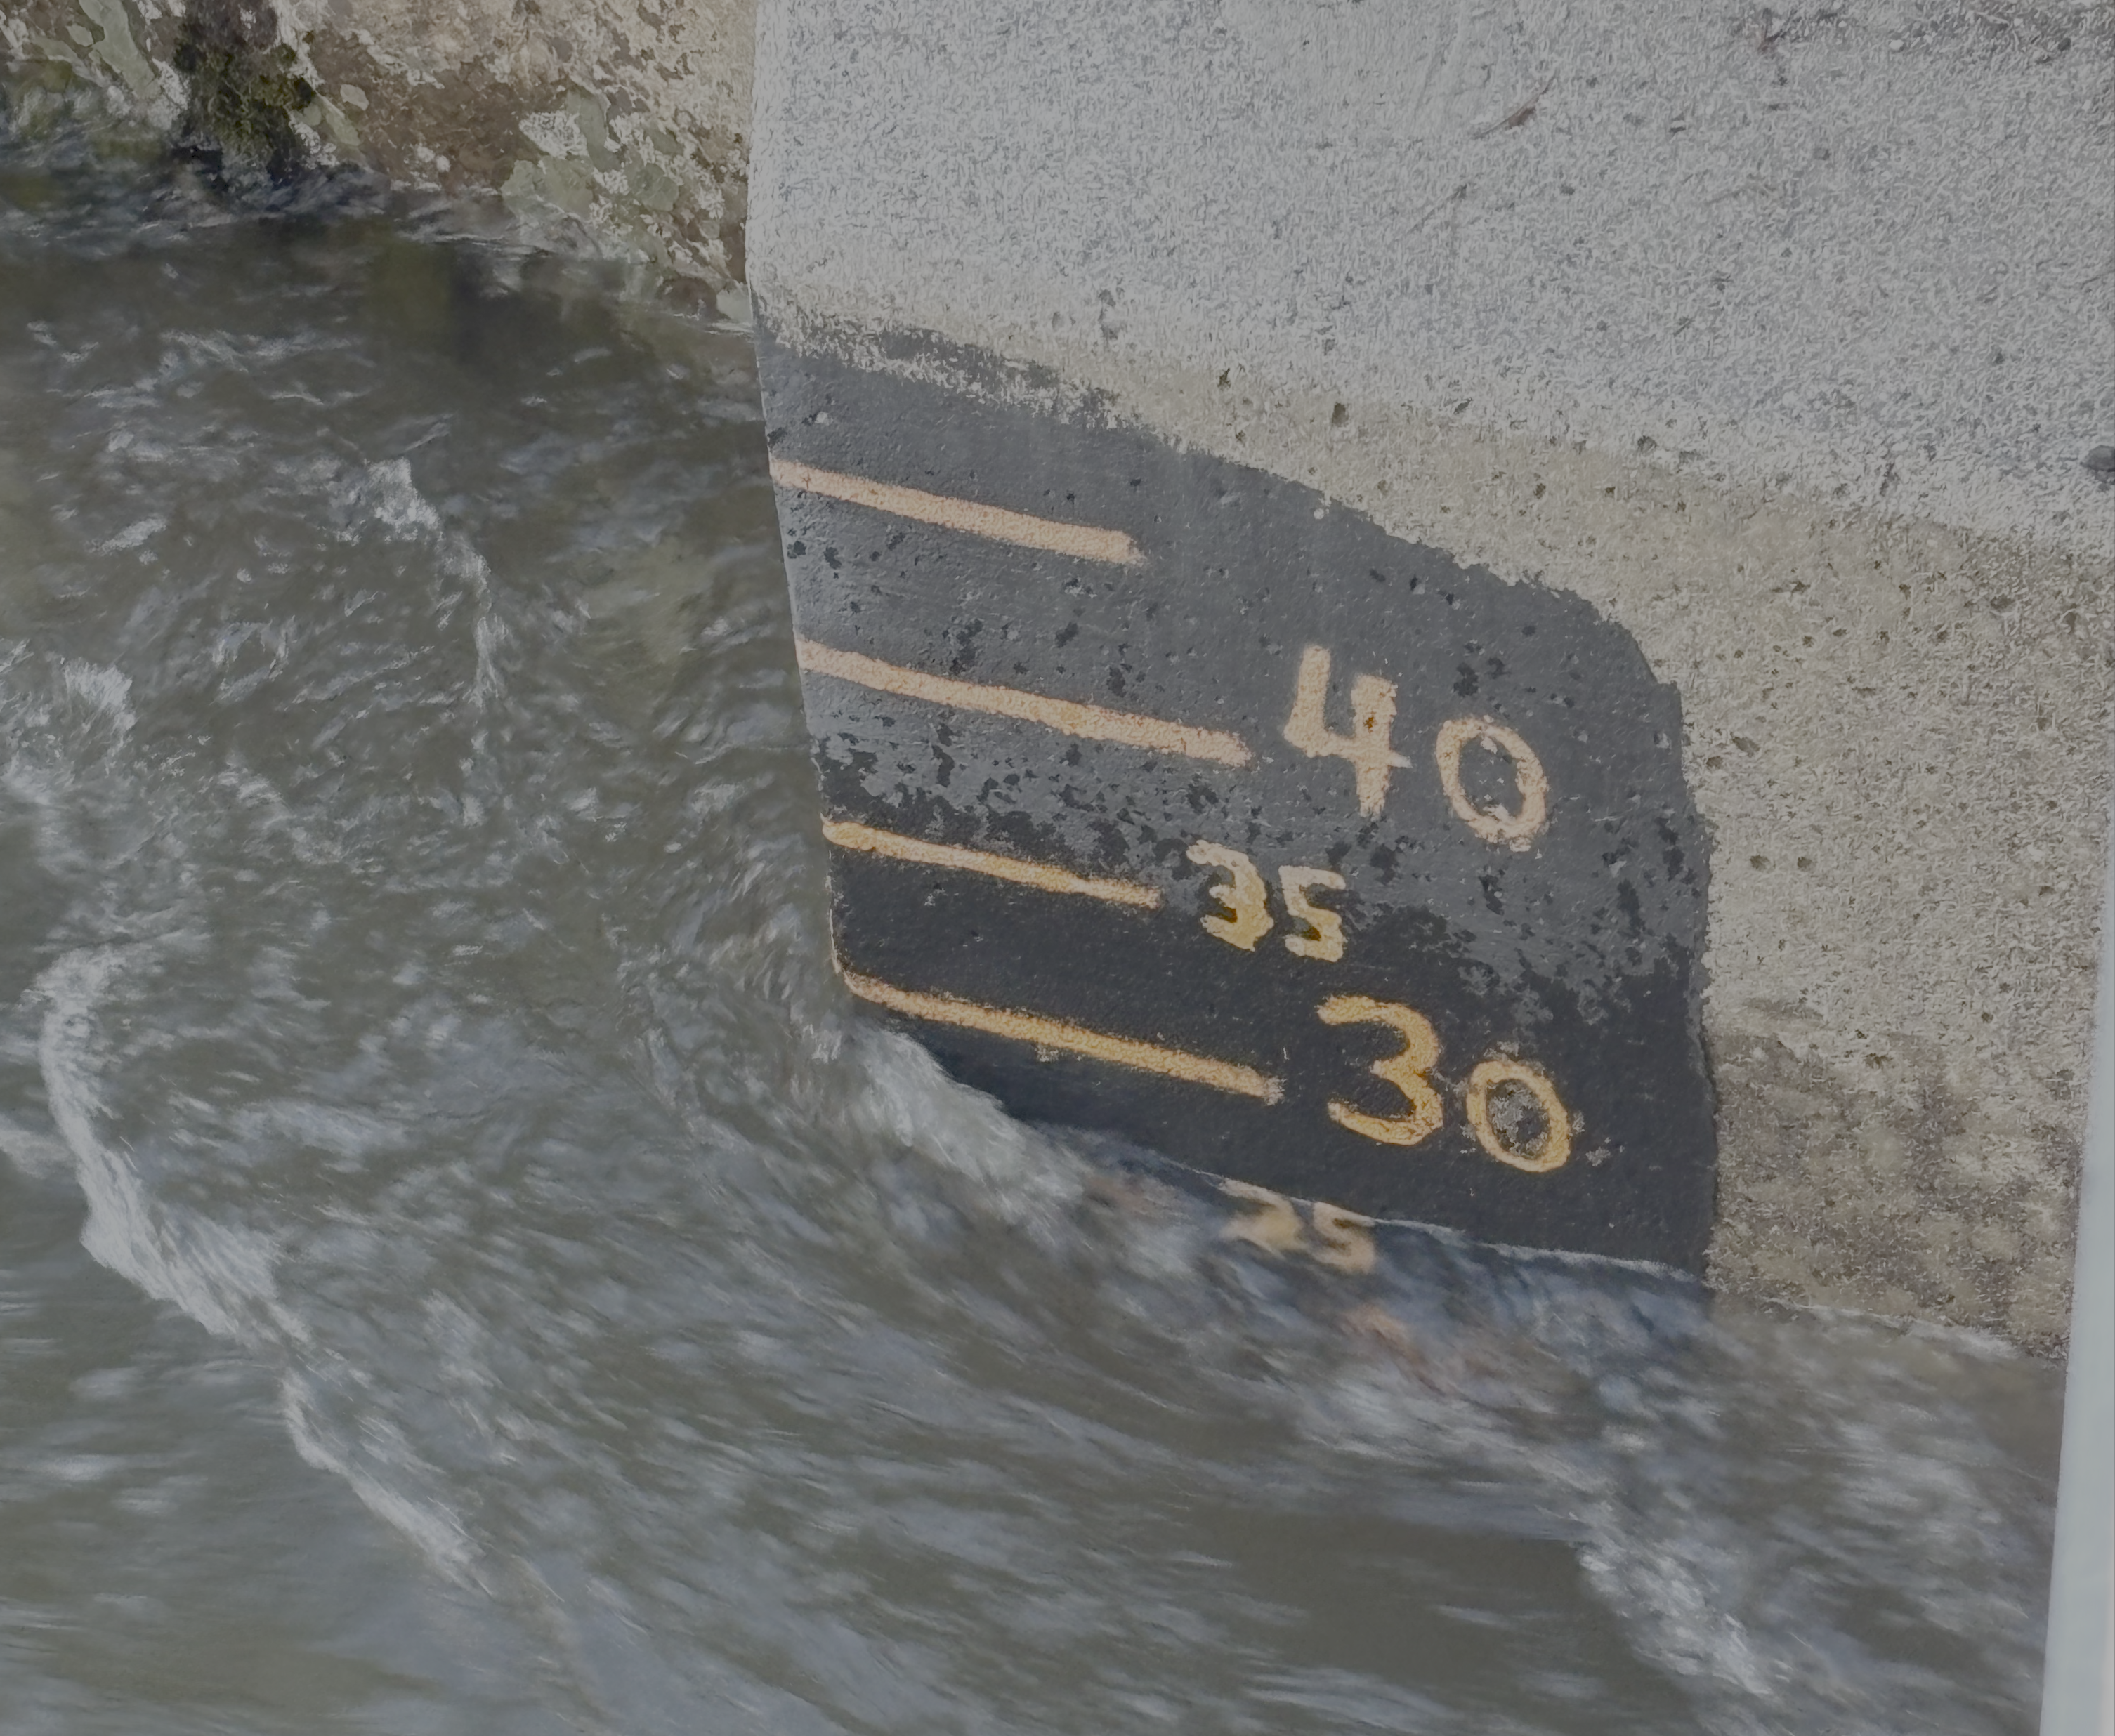
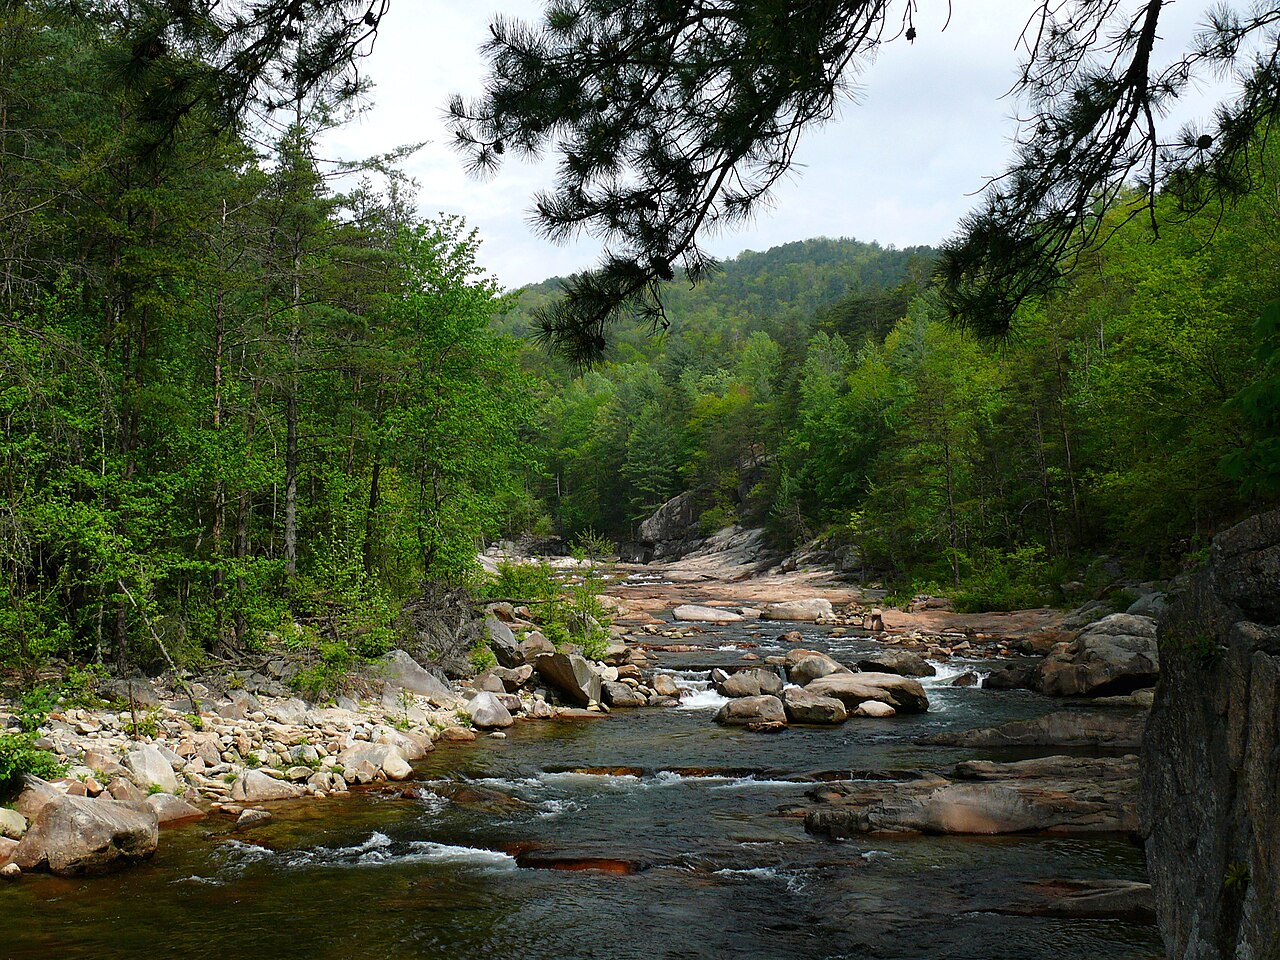
Left: A typical bridge gage on an unmonitored stream. Right: Wilson Creek with summertime low-flows (too low to kayak).
Data informatics
There’s no USGS stream gage on Wilson Creek, so deciding to drive there to kayak was based on a mix of heuristics based on the weather report and flows on nearby rivers with online gages. To know the level once we got there, we would look at an old painted gage on the bridge. In the era of ‘big data’ this might sound surprising, but in reality many, many of the rivers and creeks are unmonitored.
Spatial scales
Looking at the streamflow on nearby rivers (that did have online USGS gages) wasn’t enough to know the level. On many occasions, we would drive to the river completely confident that it was at a high enough level only to be disappointed when we arrived.
Seasonality and the earth’s energy budget
It rains about as much in the summer as the winter in the Appalachians, but the river flows at a runnable level much more rarely in the Summer and Fall. Why is this? The answer is evapotranspiration – more rainwater evaporates from soil and transpires through plant leaves when the air is warmer and the sun is stronger.
When I went to college at UNC Chapel Hill, I was thrilled to learn that what felt like esoteric knowledge of streamflow was something that I could actually learn about in college coursework.
Western USA rivers — and snowmelt
In 2012/2013 I made my first ever trip to rivers of the Western USA, where not just rain — but also snowmelt and glaciers— feeds the great whitewater rivers. 2013 was coincidentally a major drought year in California, and I gradually became aware of issues related to water supply in the Sierra Nevada.
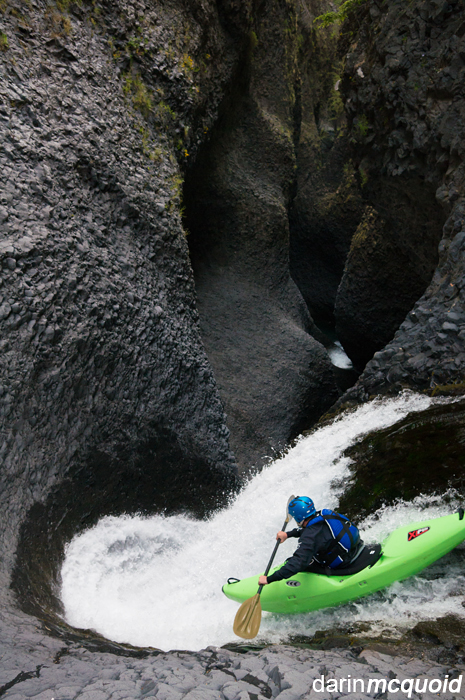
On that trip, we paddled Upper Cherry Creek in the Tuolumne river watershed, which ultimately flows into the Hetch Hetchy Reservoir. At the time this river was arguably considered in the upper echelon of class V+ whitewater adventures in the USA, and I spent all year training for it. Like Wilson Creek back home, Upper Cherry Creek didn’t have a USGS gage (at that time), and on top of that it was about a 10 mile hike across hot Sierra Nevada granite to arrive at the river and get sight of the river level. No one has more skin in the game than whitewater kayakers when it comes to predicting river flows, particularly on the challenging rivers of the Sierra Nevada. Just a little bit too much water can mean the difference between safe passage over certain rapids and challenging portages up and out of deep river canyons around hazardous ones. I remember sitting in a cafe in Groveland, CA scouring the internet trying to understand how much snow was left in the Tuolumne watershed, or for any scrap of information that might help us figure out when we could hike in and safely paddle the river. One way or another I came across a map of SNODAS, but was then left with the question of how to actually translate that information (a snapshot of snowpack across the watershed) into the streamflow in the river.
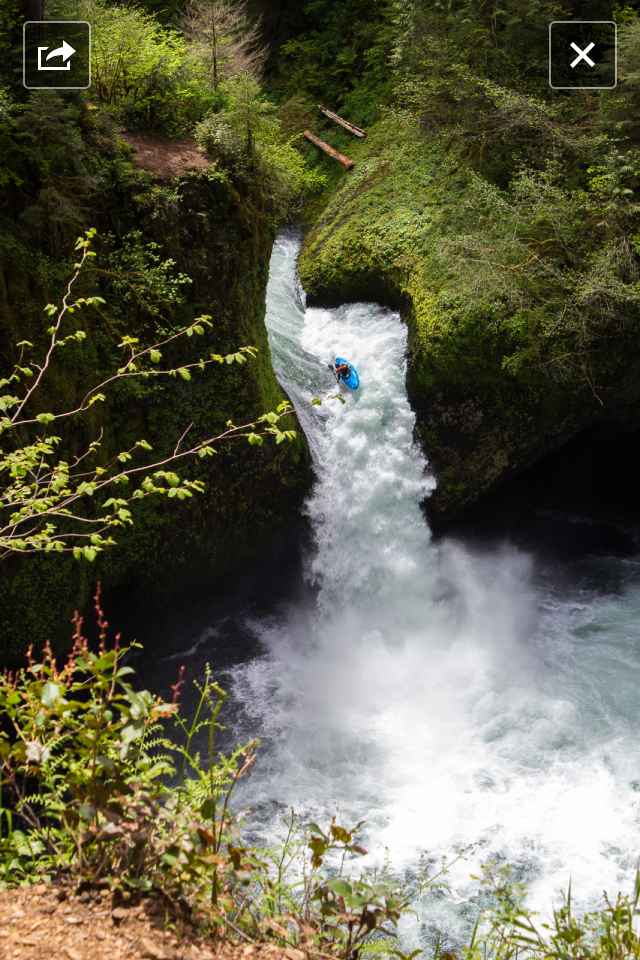
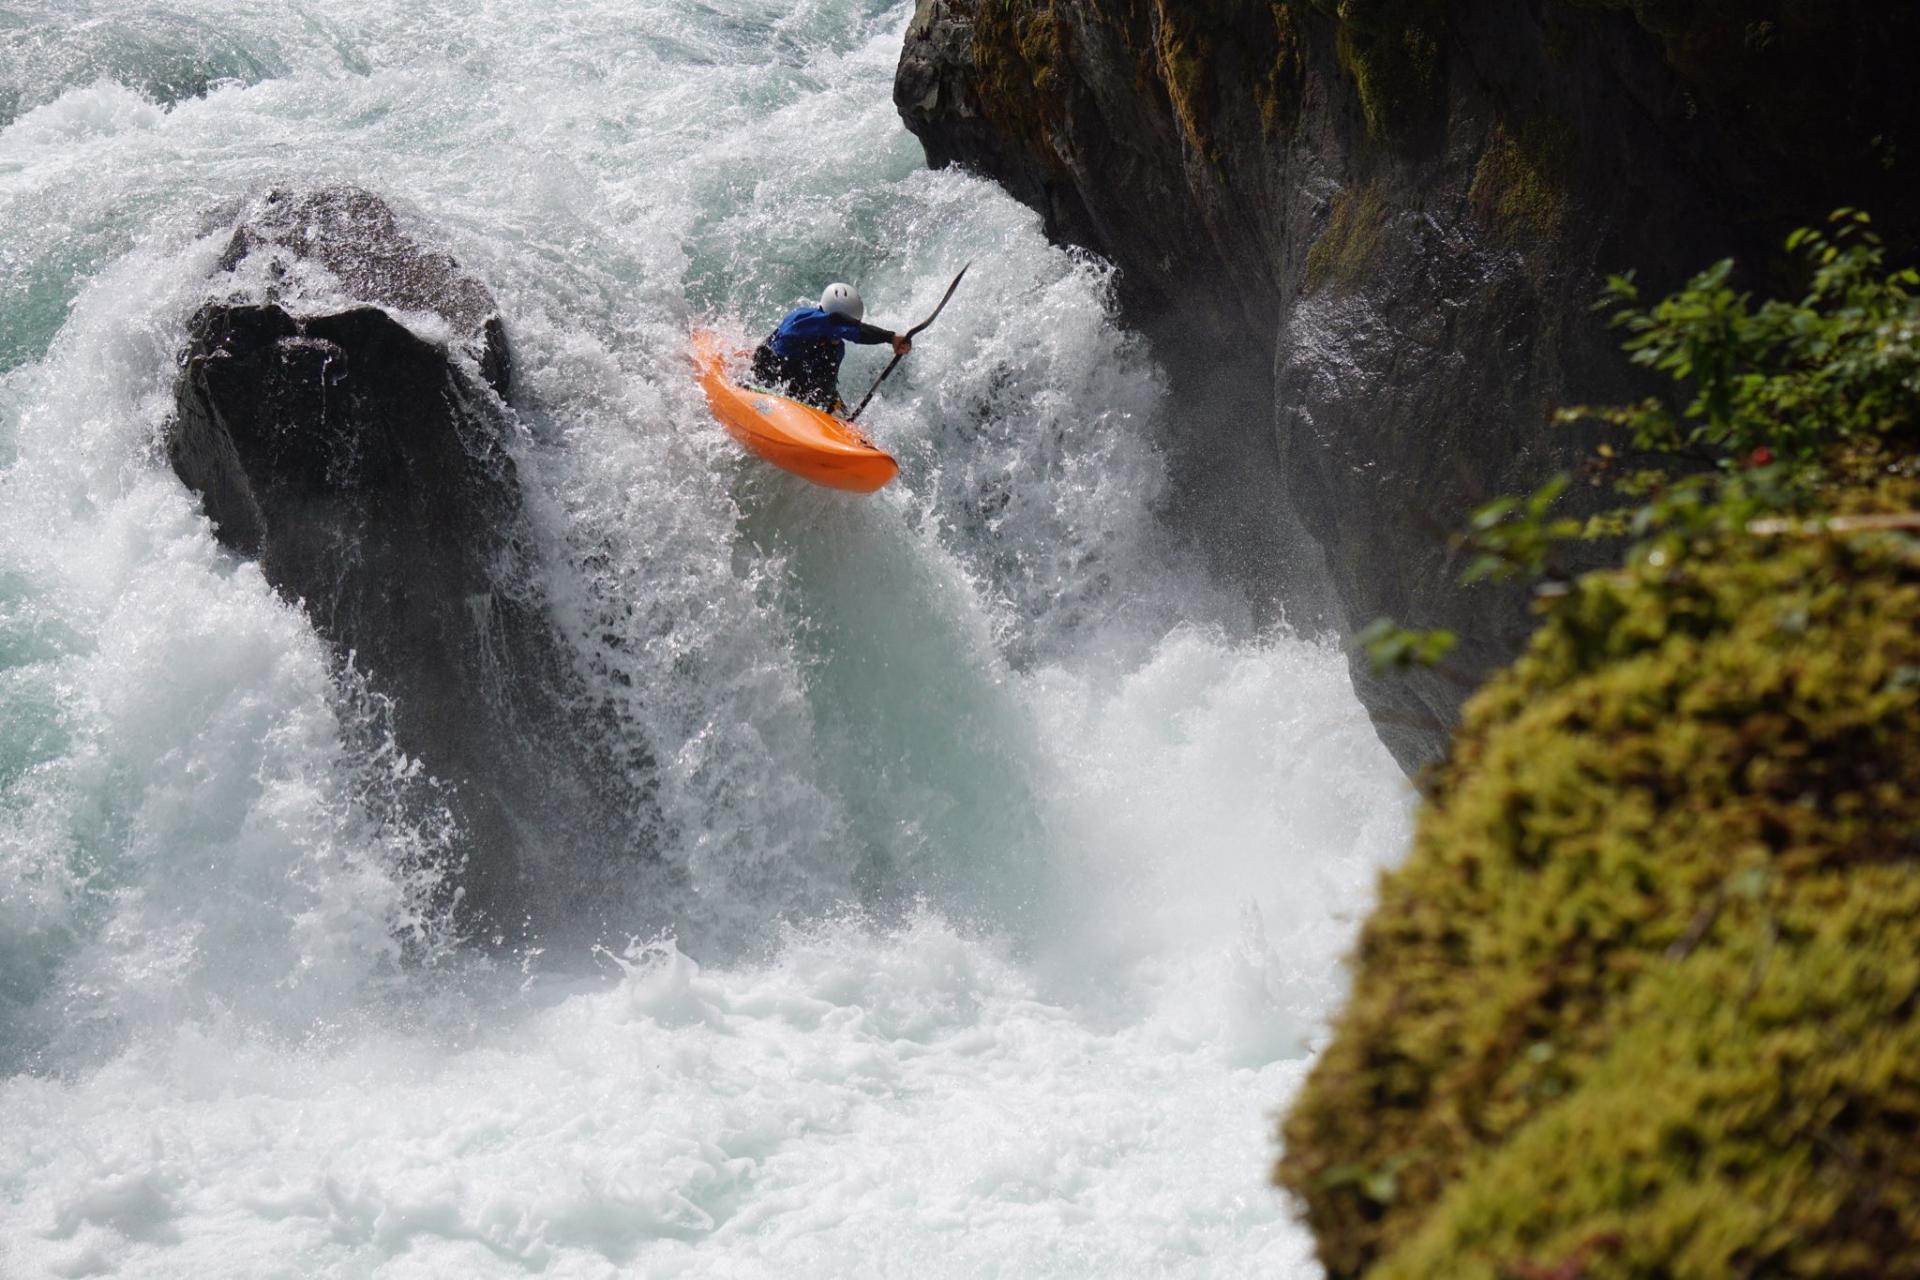
The author kayaking punchbowl falls in the Columbia river gorge, Oregon. Spring 2014.
Early academic work
These experiences with rivers and streamflow have motivated, indirectly or directly, all of the research that I’ve done to-date. The questions are more or less summarized as such:
- How much water is in a watershed at any given time?
- How much of that water will become streamflow, and when?
- How sensitive is streamflow to a changing climate?
As I began my M.S. degree at Boise State University, there was a growing awareness that many of the questions in 1-3 can really depend on the data that we put into numerical models of the hydrologic cycle. It’s straightforward enough to write down what we think are the governing physical principles that control the flow of water over and through watersheds and turn those into computer code. But running these models requires climate inputs — precipitation, temperature, wind, etc.
At the same time, many climate datasets (for both the recent past and future projections of the climate) are fairly “coarse”, meaning only a handful of grid cells would cover the entirety of a watershed like Upper Cherry or Wilson creek. And moreover, those datasets are based on sparse observations that may not sample the spatial variability of the climate across the watershed. Even casual observers are probably aware that the weather in mountain regions is highly variable, so ideally the inputs into a model should realistically capture this variability.
As it turns out, many of the datasets that researchers use diverge wildly in mountain areas for the most fundamental variable —- precipitation. Groundwater contributes to streamflow as well, but precipitation dominates streamflow and snowpack variability in the semi-arid Mediterranean climates of the Western USA. There was growing awareness that certain ‘high resolution’ numerical weather models actually do a surprisingly good job of simulating precipitation variability in mountains, leading to a controversial paper a few years ago.
So, for these reasons, my Ph.D. and M.S. largely focused on these types of models — specifically the Weather Research and Forecasting (WRF) model. Along the way I became interested in other questions — how much does the land actually influence the atmosphere (for things like temperature and precipitation).
Recent work
During my postdoctoral research I became involved in ARM program research — one of the primary ground-based observing facilities for making high-quality observations of the atmosphere. This has resulted in work across a few different directions, including evaluating the causes and patterns of near-surface air temperature underestimation by atmospheric models (including WRF), the effects of clouds on the energy available for snowmelt, and the mechanisms responsible for surface-hoar growth onto snowpacks.
These topics may seem far afield from streamflow – but, the last question – “how sensitive is streamflow to a changing climate?” really means thinking critically about the energetic processes on the land surface, not just precipitation, and also making sure that our process models are capturing the most important processes that govern the water cycle.
Conclusions
My career so far has spanned disciplines of atmospheric science and hydrology. While the earth makes no distinction between the two, the way that academia operates does make a distinction, and this can at times be frustrating. We’re currently at about 430 PPM of atmospheric CO2 in the atmosphere. When I entered undergrad, this value was 390 PPM. There is reason to be hopeful, but we are still a long way from reversing this process. What does this mean for rivers? There has been a lot of positive progress in this direction, but there’s still lots of work to do. Recent events like the floods of Western North Carolina from Hurricane Helene (more on that later) underscore the immediacy of changes taking place on the hydrologic cycle.