Record spring heat
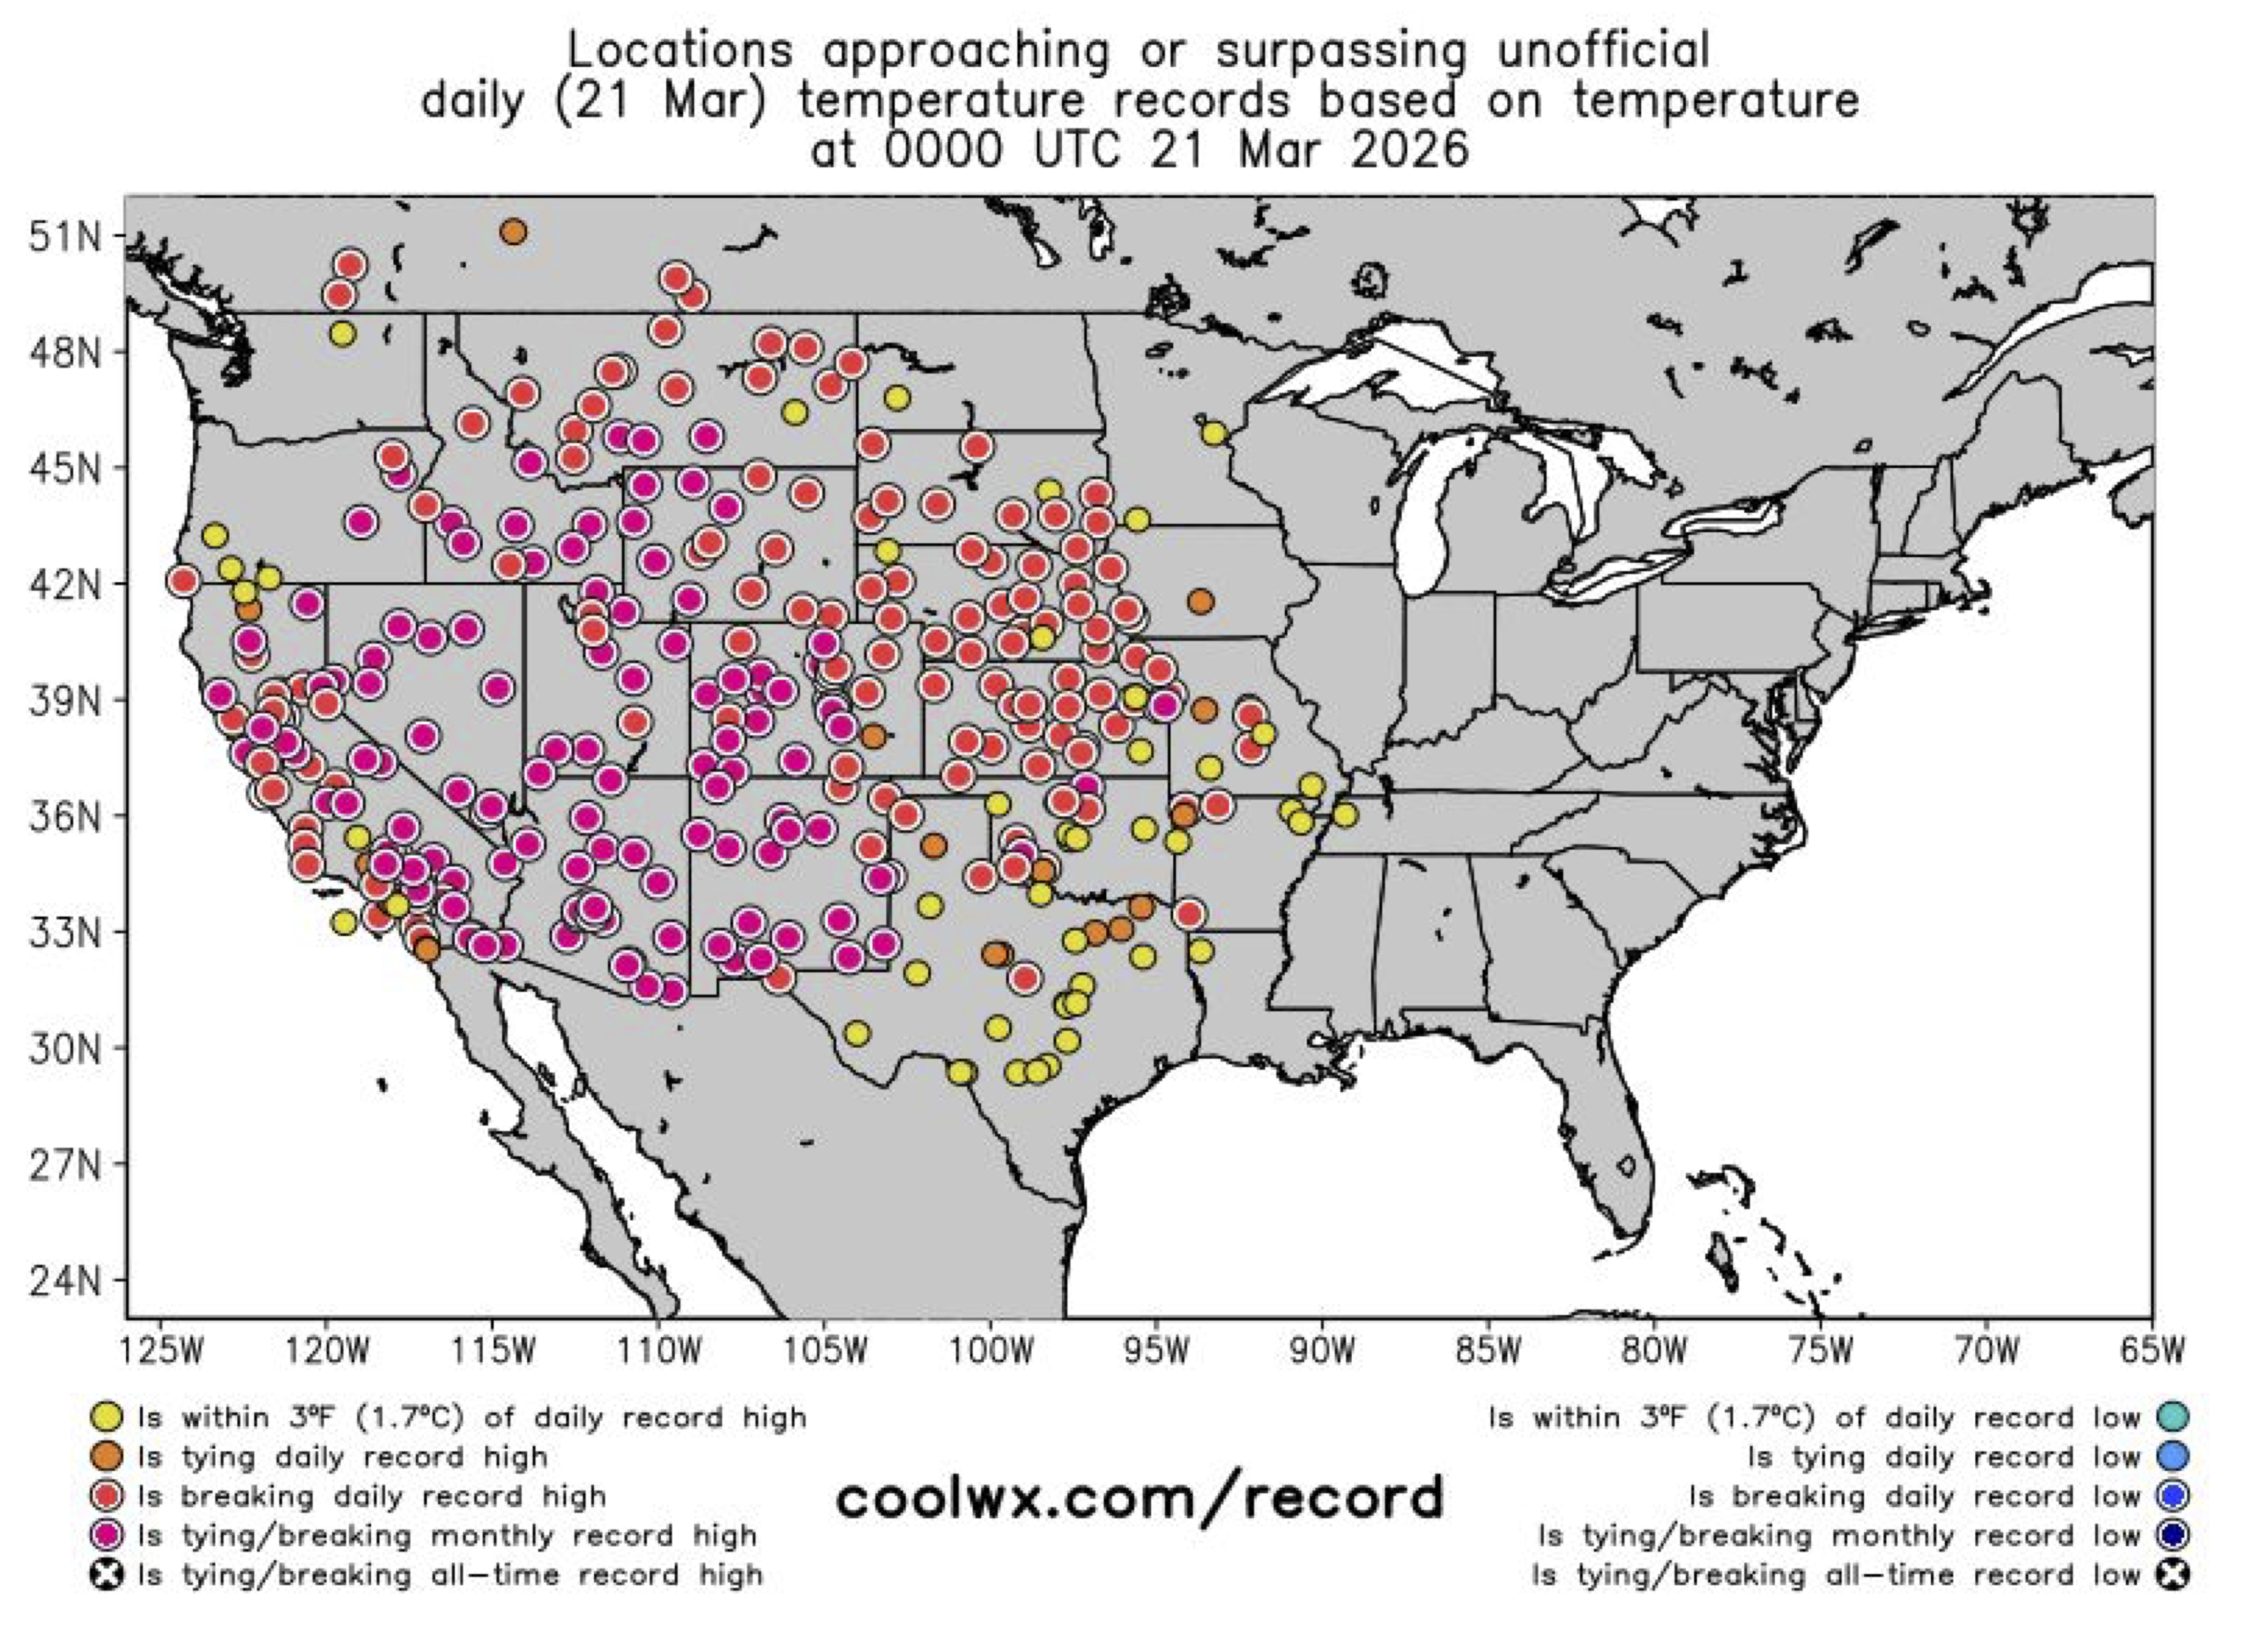
Spring temperatures have been remarkably warm across most of the western USA – so much so, that it’s nearly impossible for these temperatures to occur without anthropogenic climate change. Many daily temperature records were set across CA and the entire Western USA.
What does this mean for snow and water?
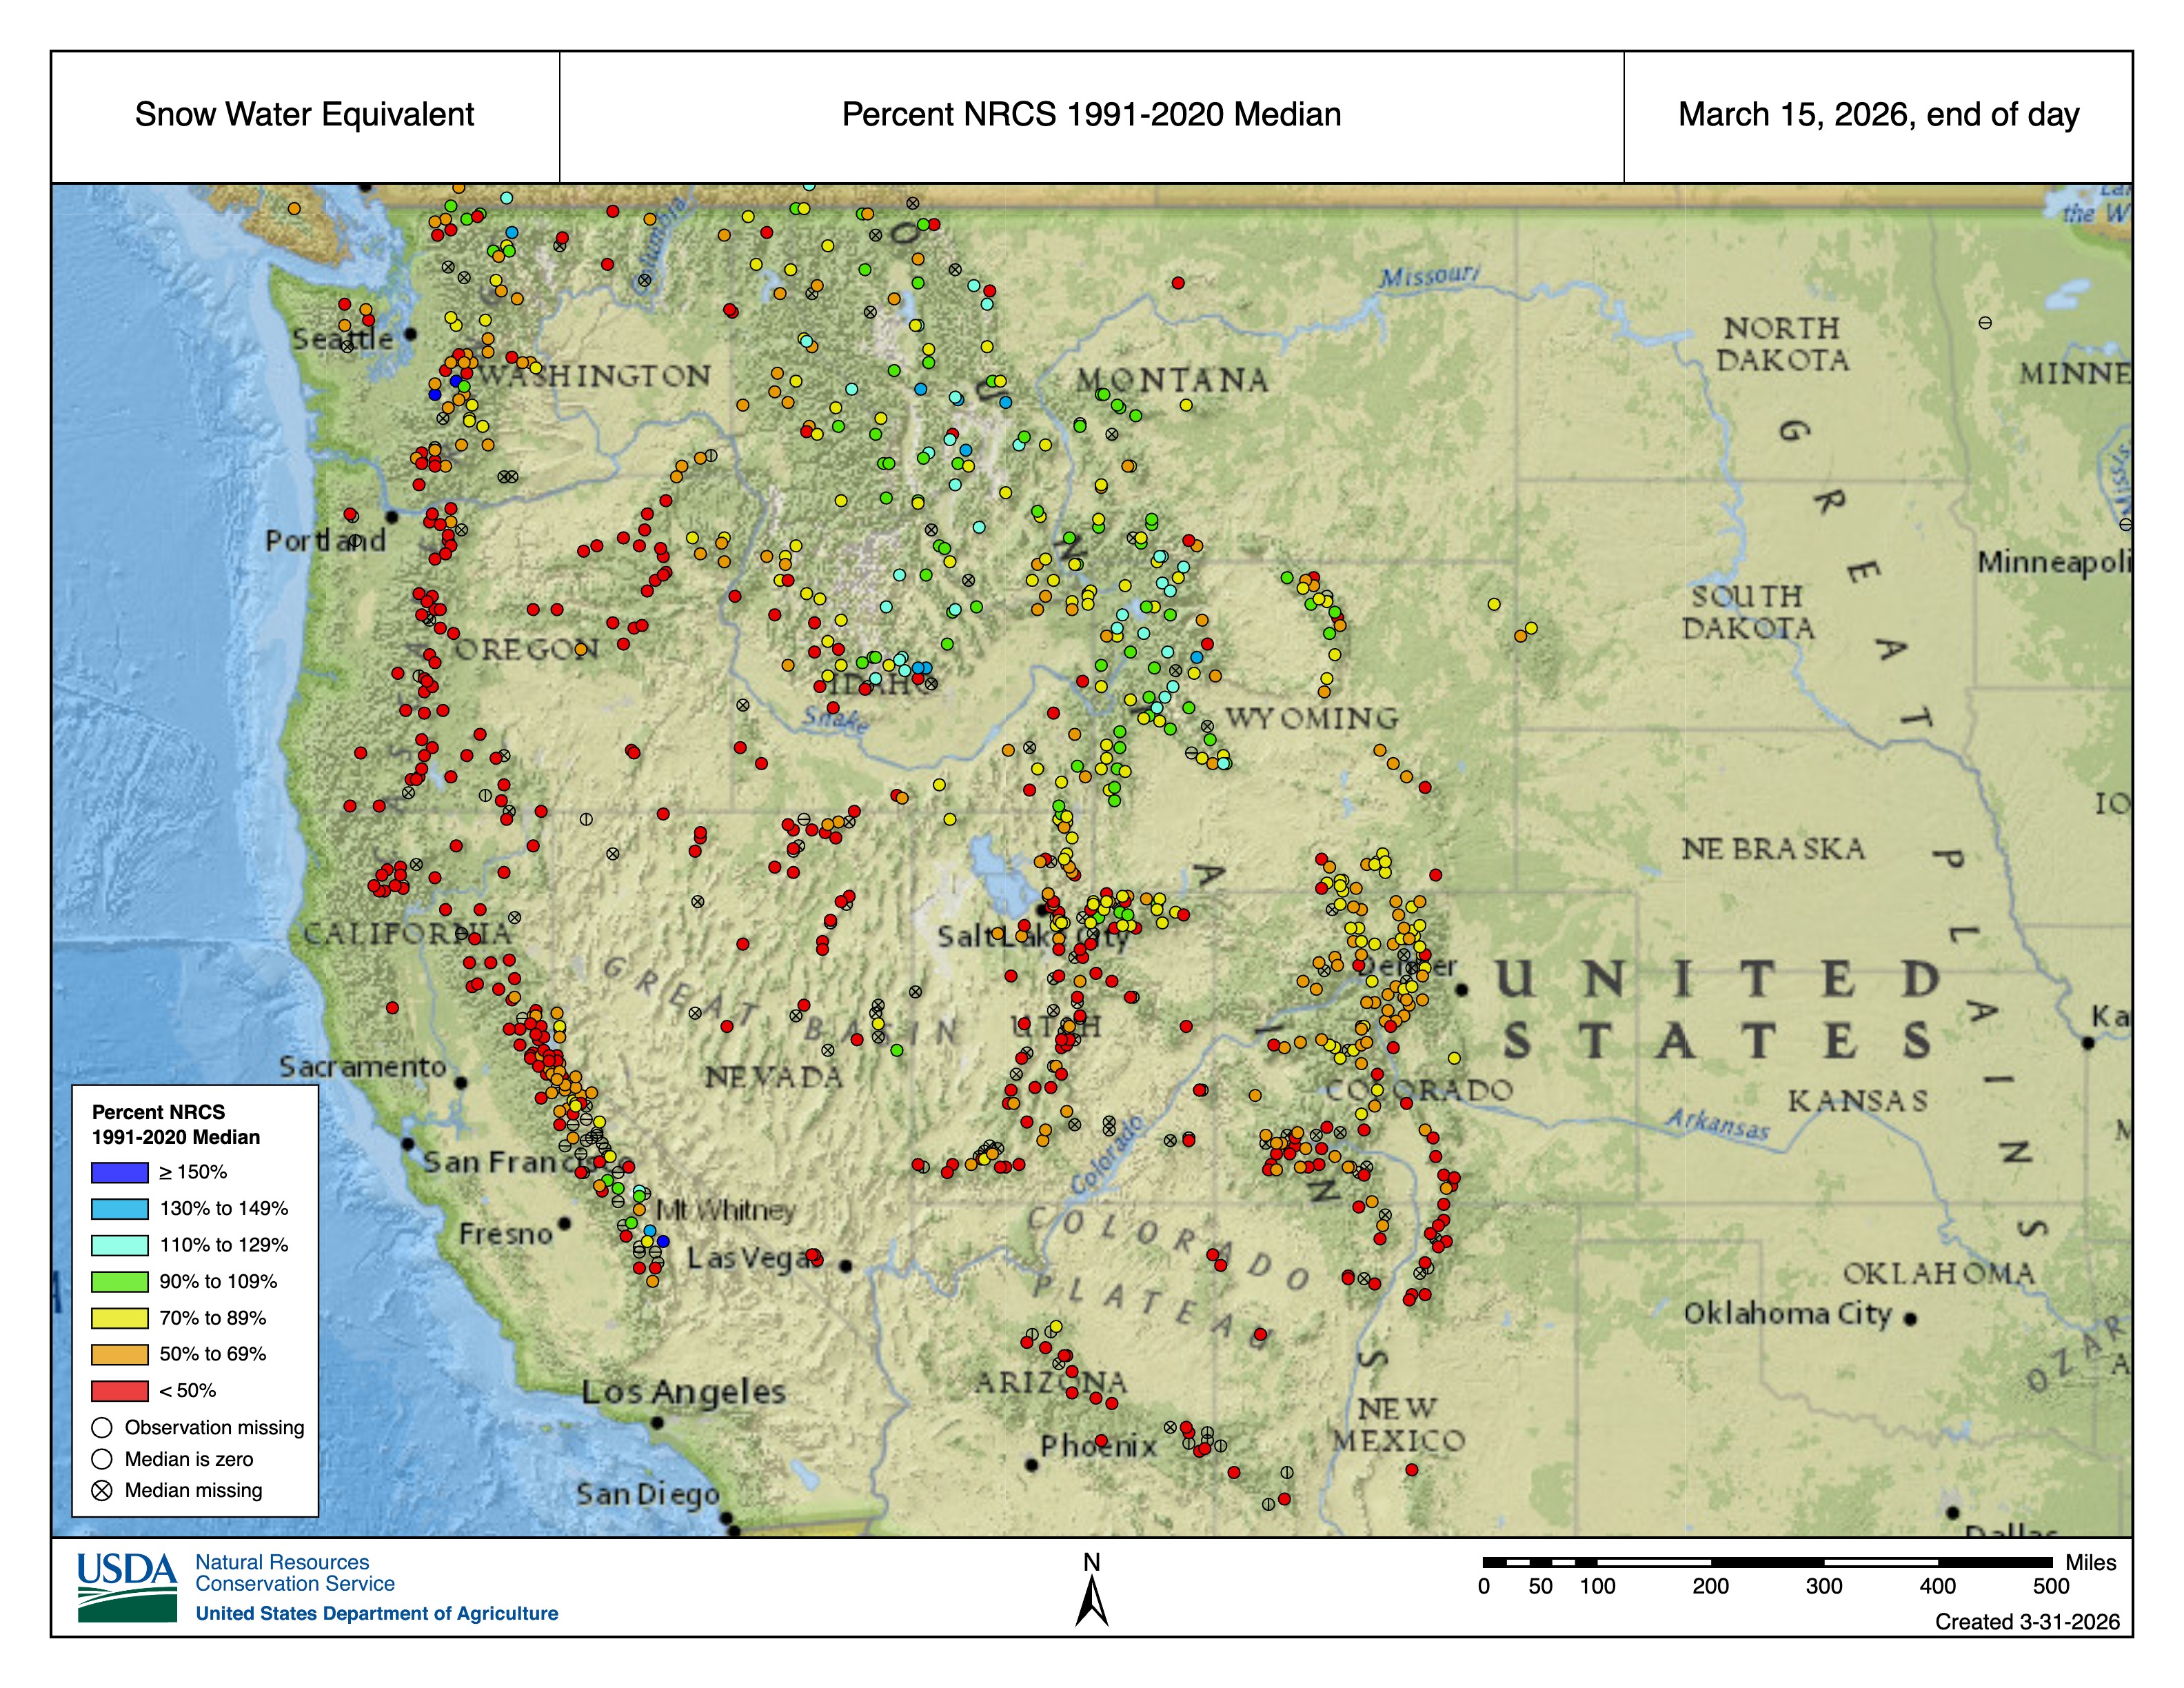
This has led to a lot of discussion about the implications for water resources. Warmer temperatures do a number of things to the water cycle, including drying out soils and causing snow to melt earlier. As of March (and prior to the heatwave) the snowpack was well below median for many regions of the western USA, particularly at low elevations.
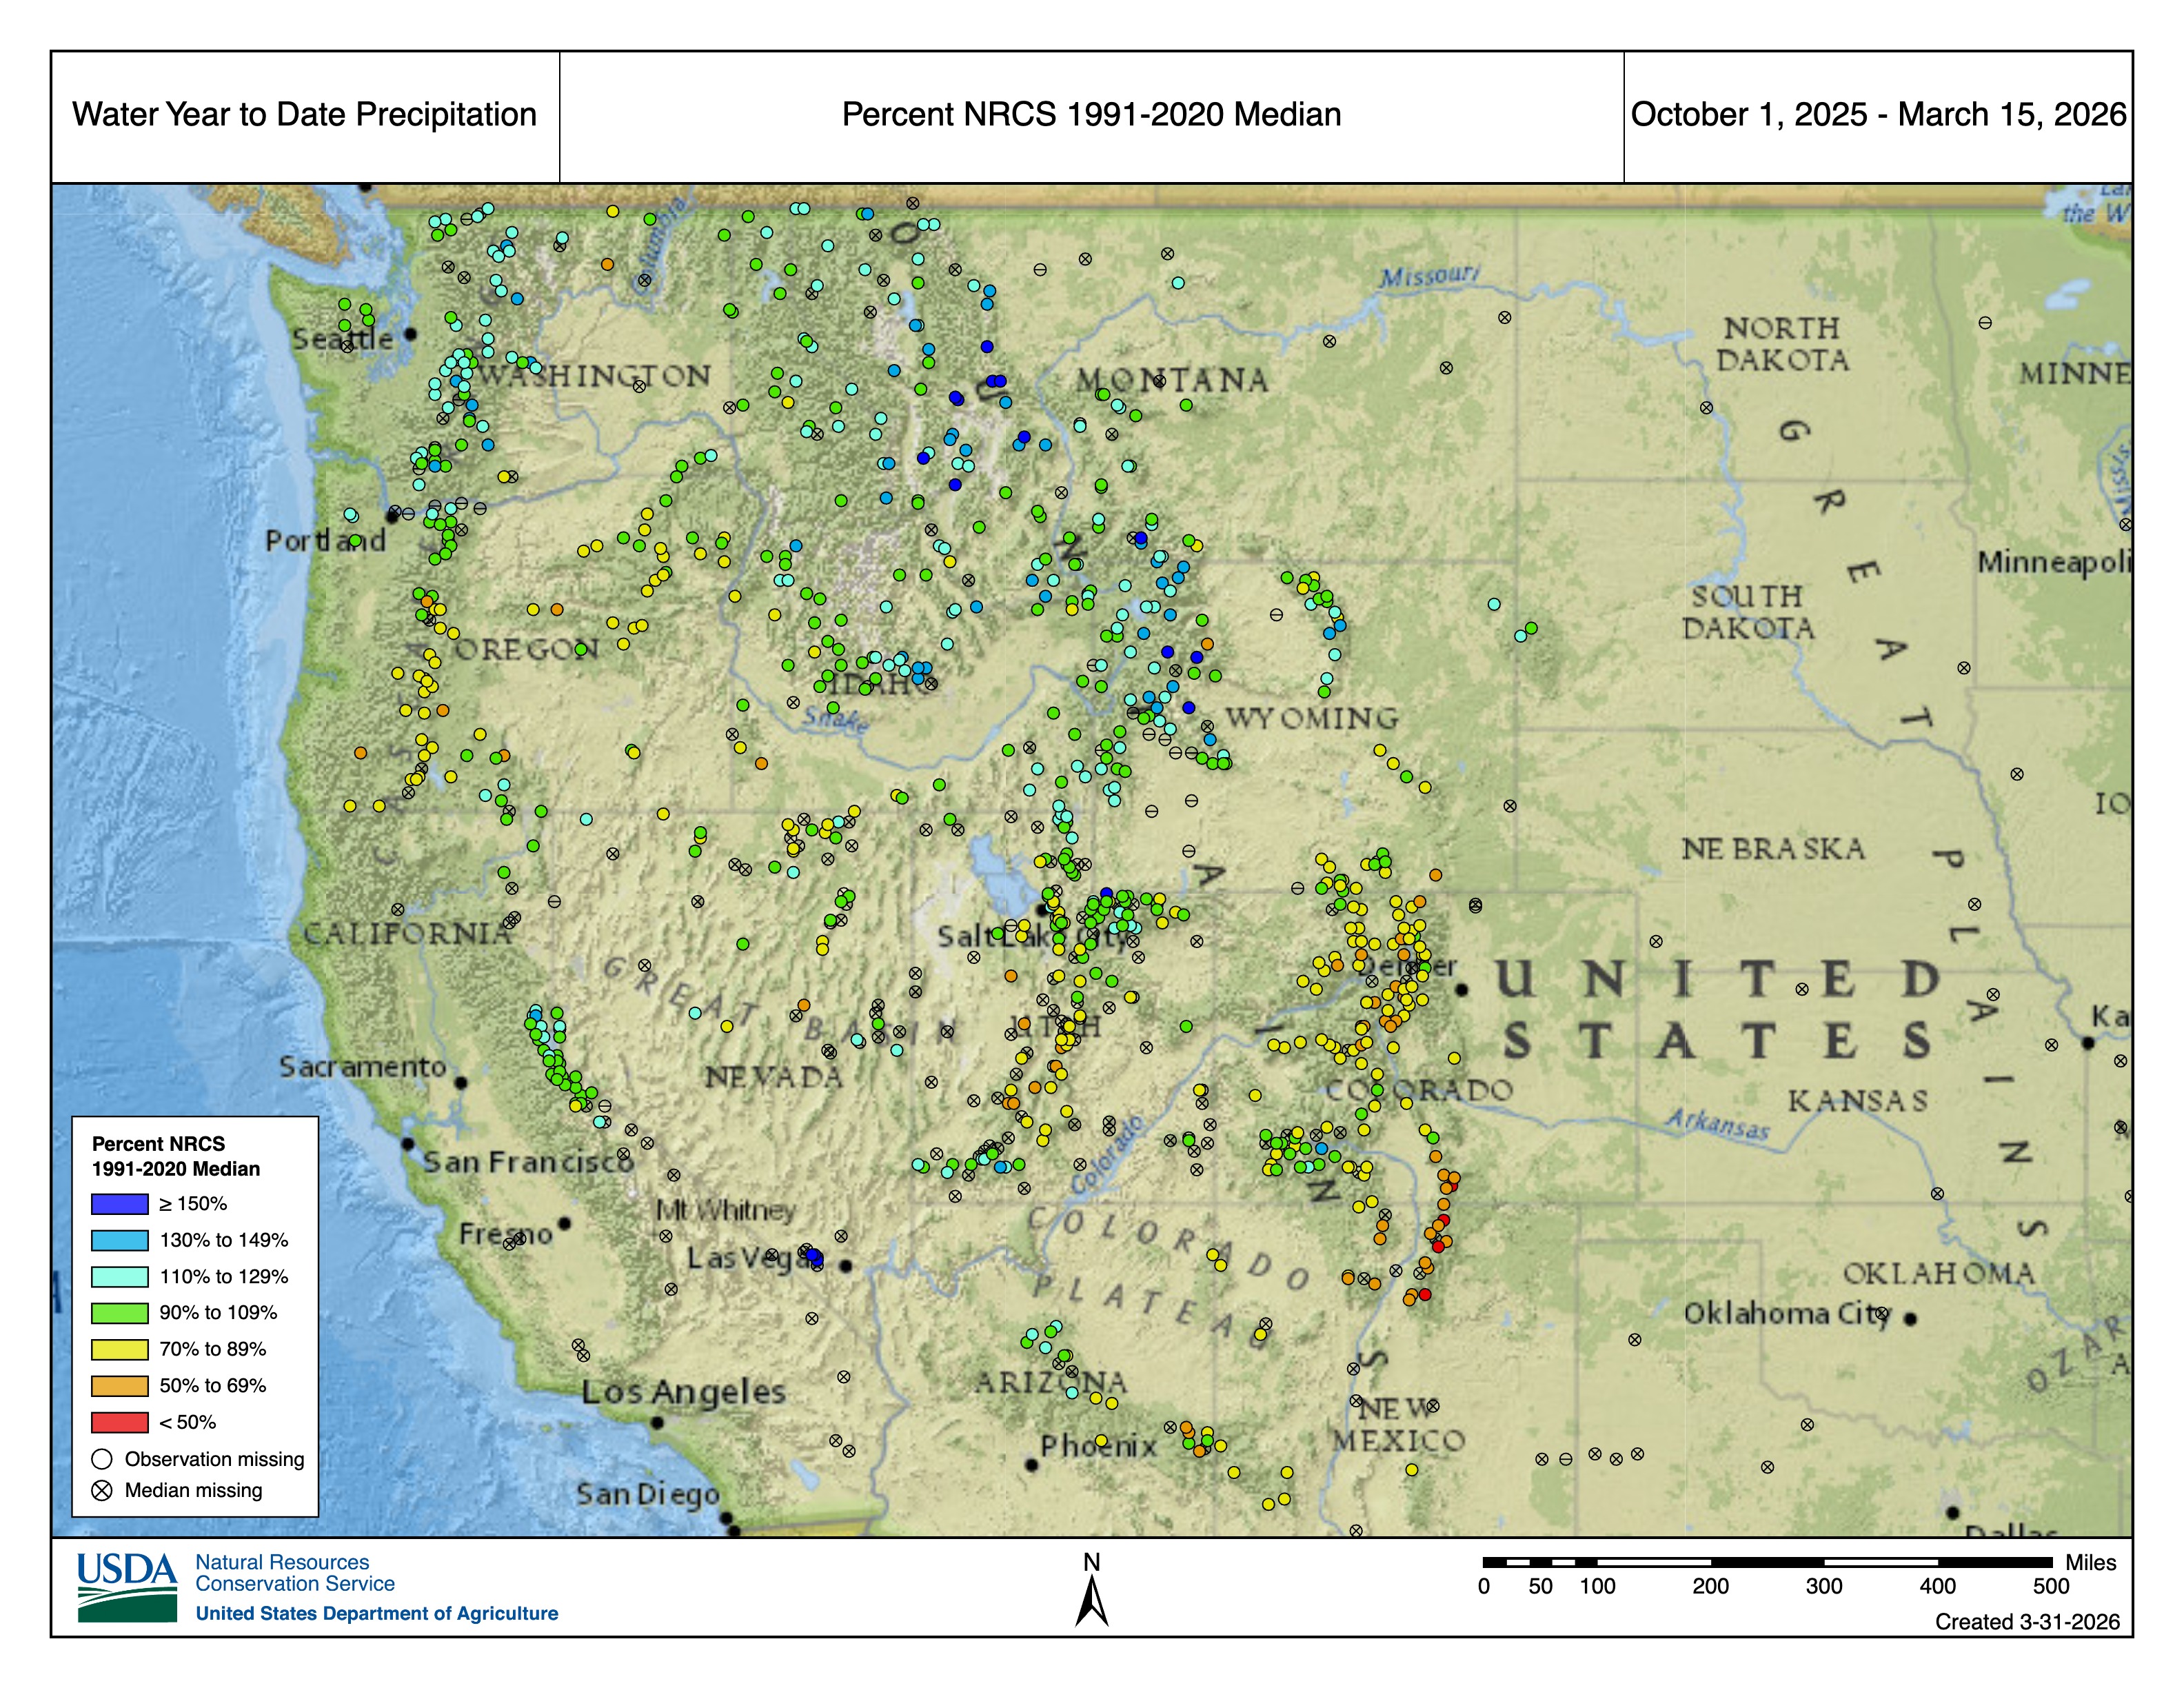
However, the same is not true for precipitation. Many regions of the western USA are actually average or near-average for this time of year. The discrepancy between snow and precipitation is largely because of 1) early melt and 2) rain falling instead of snow, even in generally rain-free parts of the Colorado Rockies. Living in Truckee, CA, I found this almost hard to believe given how many sunny days we had all winter. But, it also speaks to the increasingly episodic nature of precipitation, and how just a few intense storms can shape the water balance of the Sierras and elsewhere.
WY2026 Streamflow in the context of recent years
What happened to streamflow and snowmelt during the March heatwave? Let’s look at streamflow into Lake Clementine. This is a mostly unregulated system (there is a reservoir on the North fork of the North fork of the American) but other than that, the river is free-flowing.
The cumulative amount of streamflow for WY2026 is in fact the 4th highest since 2017 as of Mar 30th.
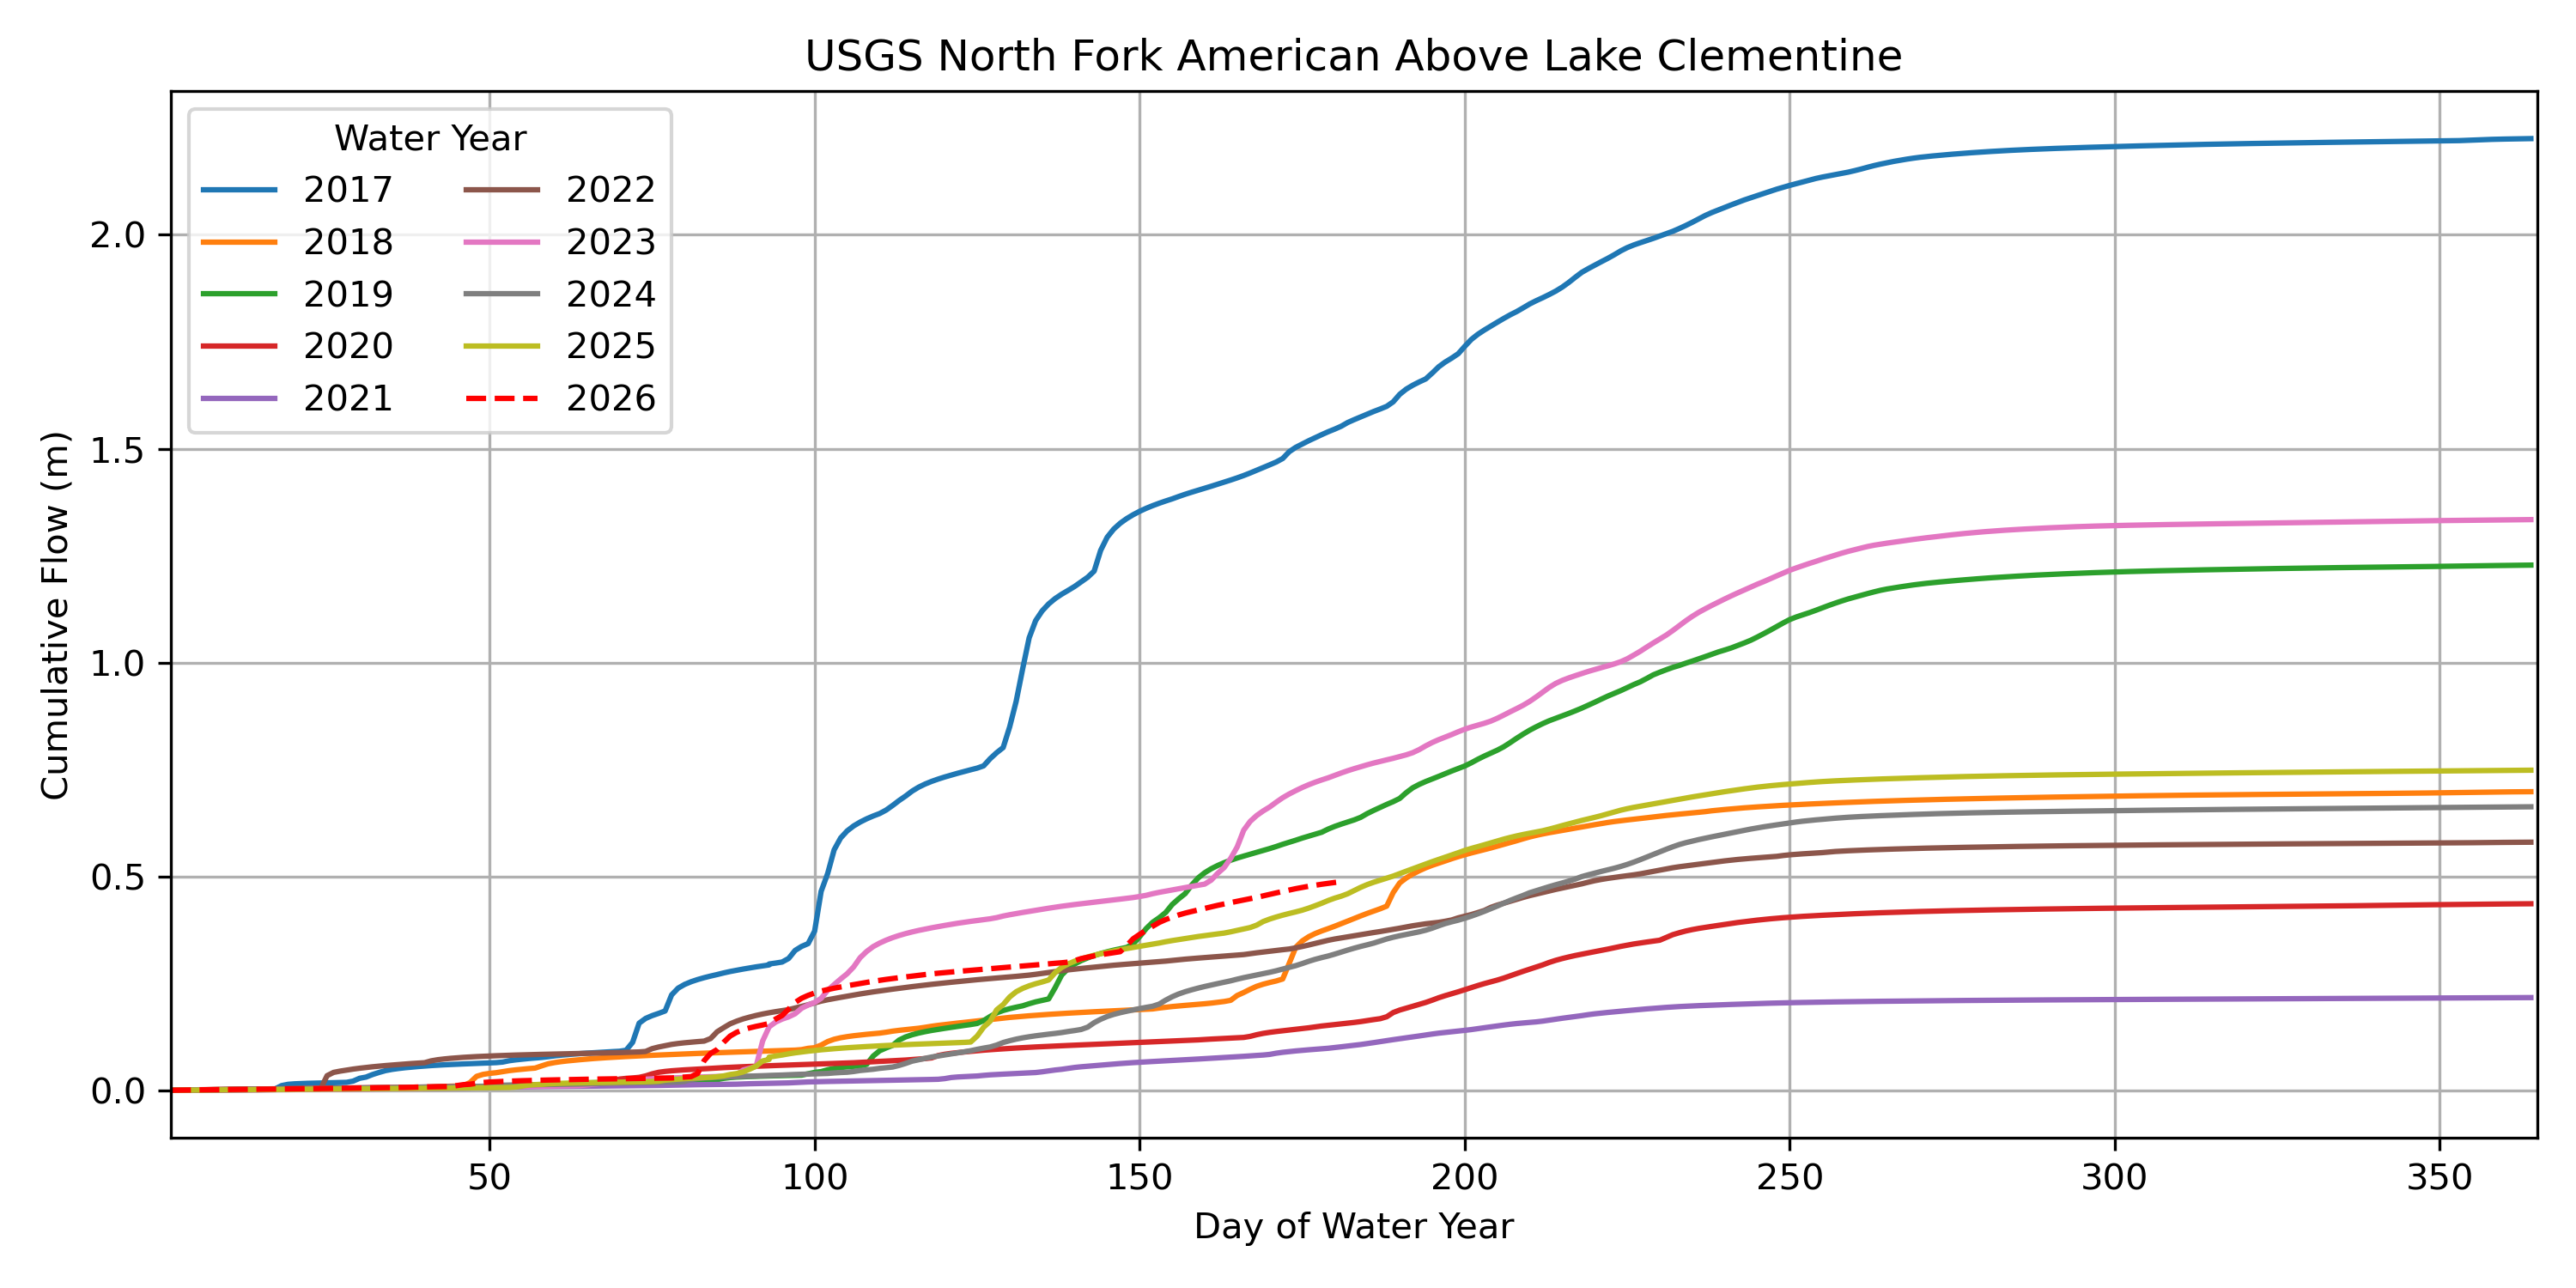
This might be surprising, but looking at the cumulative inflow shows what was going on—the river was flowing in the fall and winter more than other years. Of course, we are only in March and snow is dwindling in the Sierras—so 2025 and 2018 may ultimately surpass this year for total annual inflow.
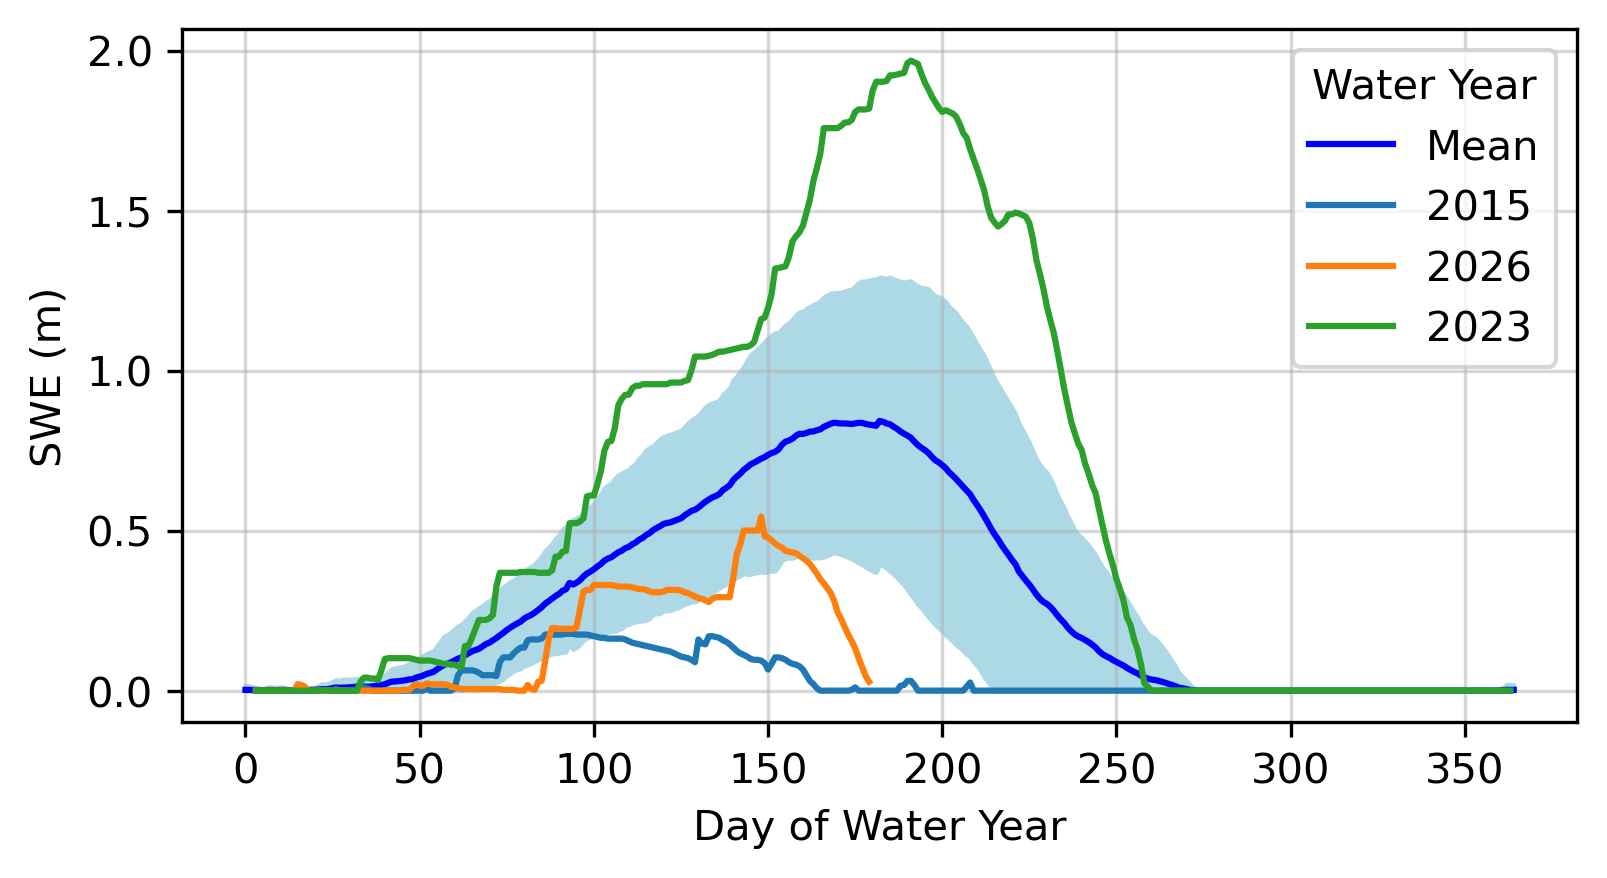
This is the snow water equivalent (SWE) at the nearby Central Sierra Snow Laboratory (which is in the adjacent Yuba river drainage). You can see the effects of warm temperatures on snowmelt. Also note that 2015 actually had lower peak SWE and completely melted out ~20 days earlier.
The timing of streamflow matters for water resources
Earlier snowmelt and low-snow accumulation have serious implications for water resources in the Sierras. For one, reservoirs are not designed to capture an entire year’s worth of precipitation, so water management has historically relied on snowmelt released naturally by snowpacks into the growing season.
To visualize this, the following chart from CW3E shows the amount of reservoir storage capacity in Northern California. In a normal year, the natural snow-reservoir adds 40% of storage on top of man-made reservoirs by April 1.

So, the effects of early melt and timing mean that water must be managed differently, and that streams and soils dry out sooner as CA enters its dry summer period.
But does the (annual) amount of streamflow depend on melt timing and rain vs. snow?
There are reasons to expect this might be the case. First, the hydrologic cycle is forever dependent on one simple mass-balance equation:
Q = P - ET +/- S,
where Q is streamflow, P is precipitation, ET is evapotranspiration (including sublimation from snow), and S is storage. At the annual timescale it’s often assumed that the change in storage is small. This may include permanent snow or ice, soil moisture, or deeper groundwater. In many systems, the amount of water lost via ET is incredibly large (easily over half of the precipitation). Temperature is the first-order driver of ET, so warmer years may in principle drive higher rates of ET, reducing water entering the stream. And snow is bright and shiny. If it melts earlier, dark soils absorb more sun which may further enhance ET.
Do we see this effect happening in 2026 in the Sierras? To attempt to answer that we can look at some data from the CSSL Snotel and North Fork American streamflow. We can normalize the streamflow data by the area of the watershed so that it has the same unit as precipitation (depth).
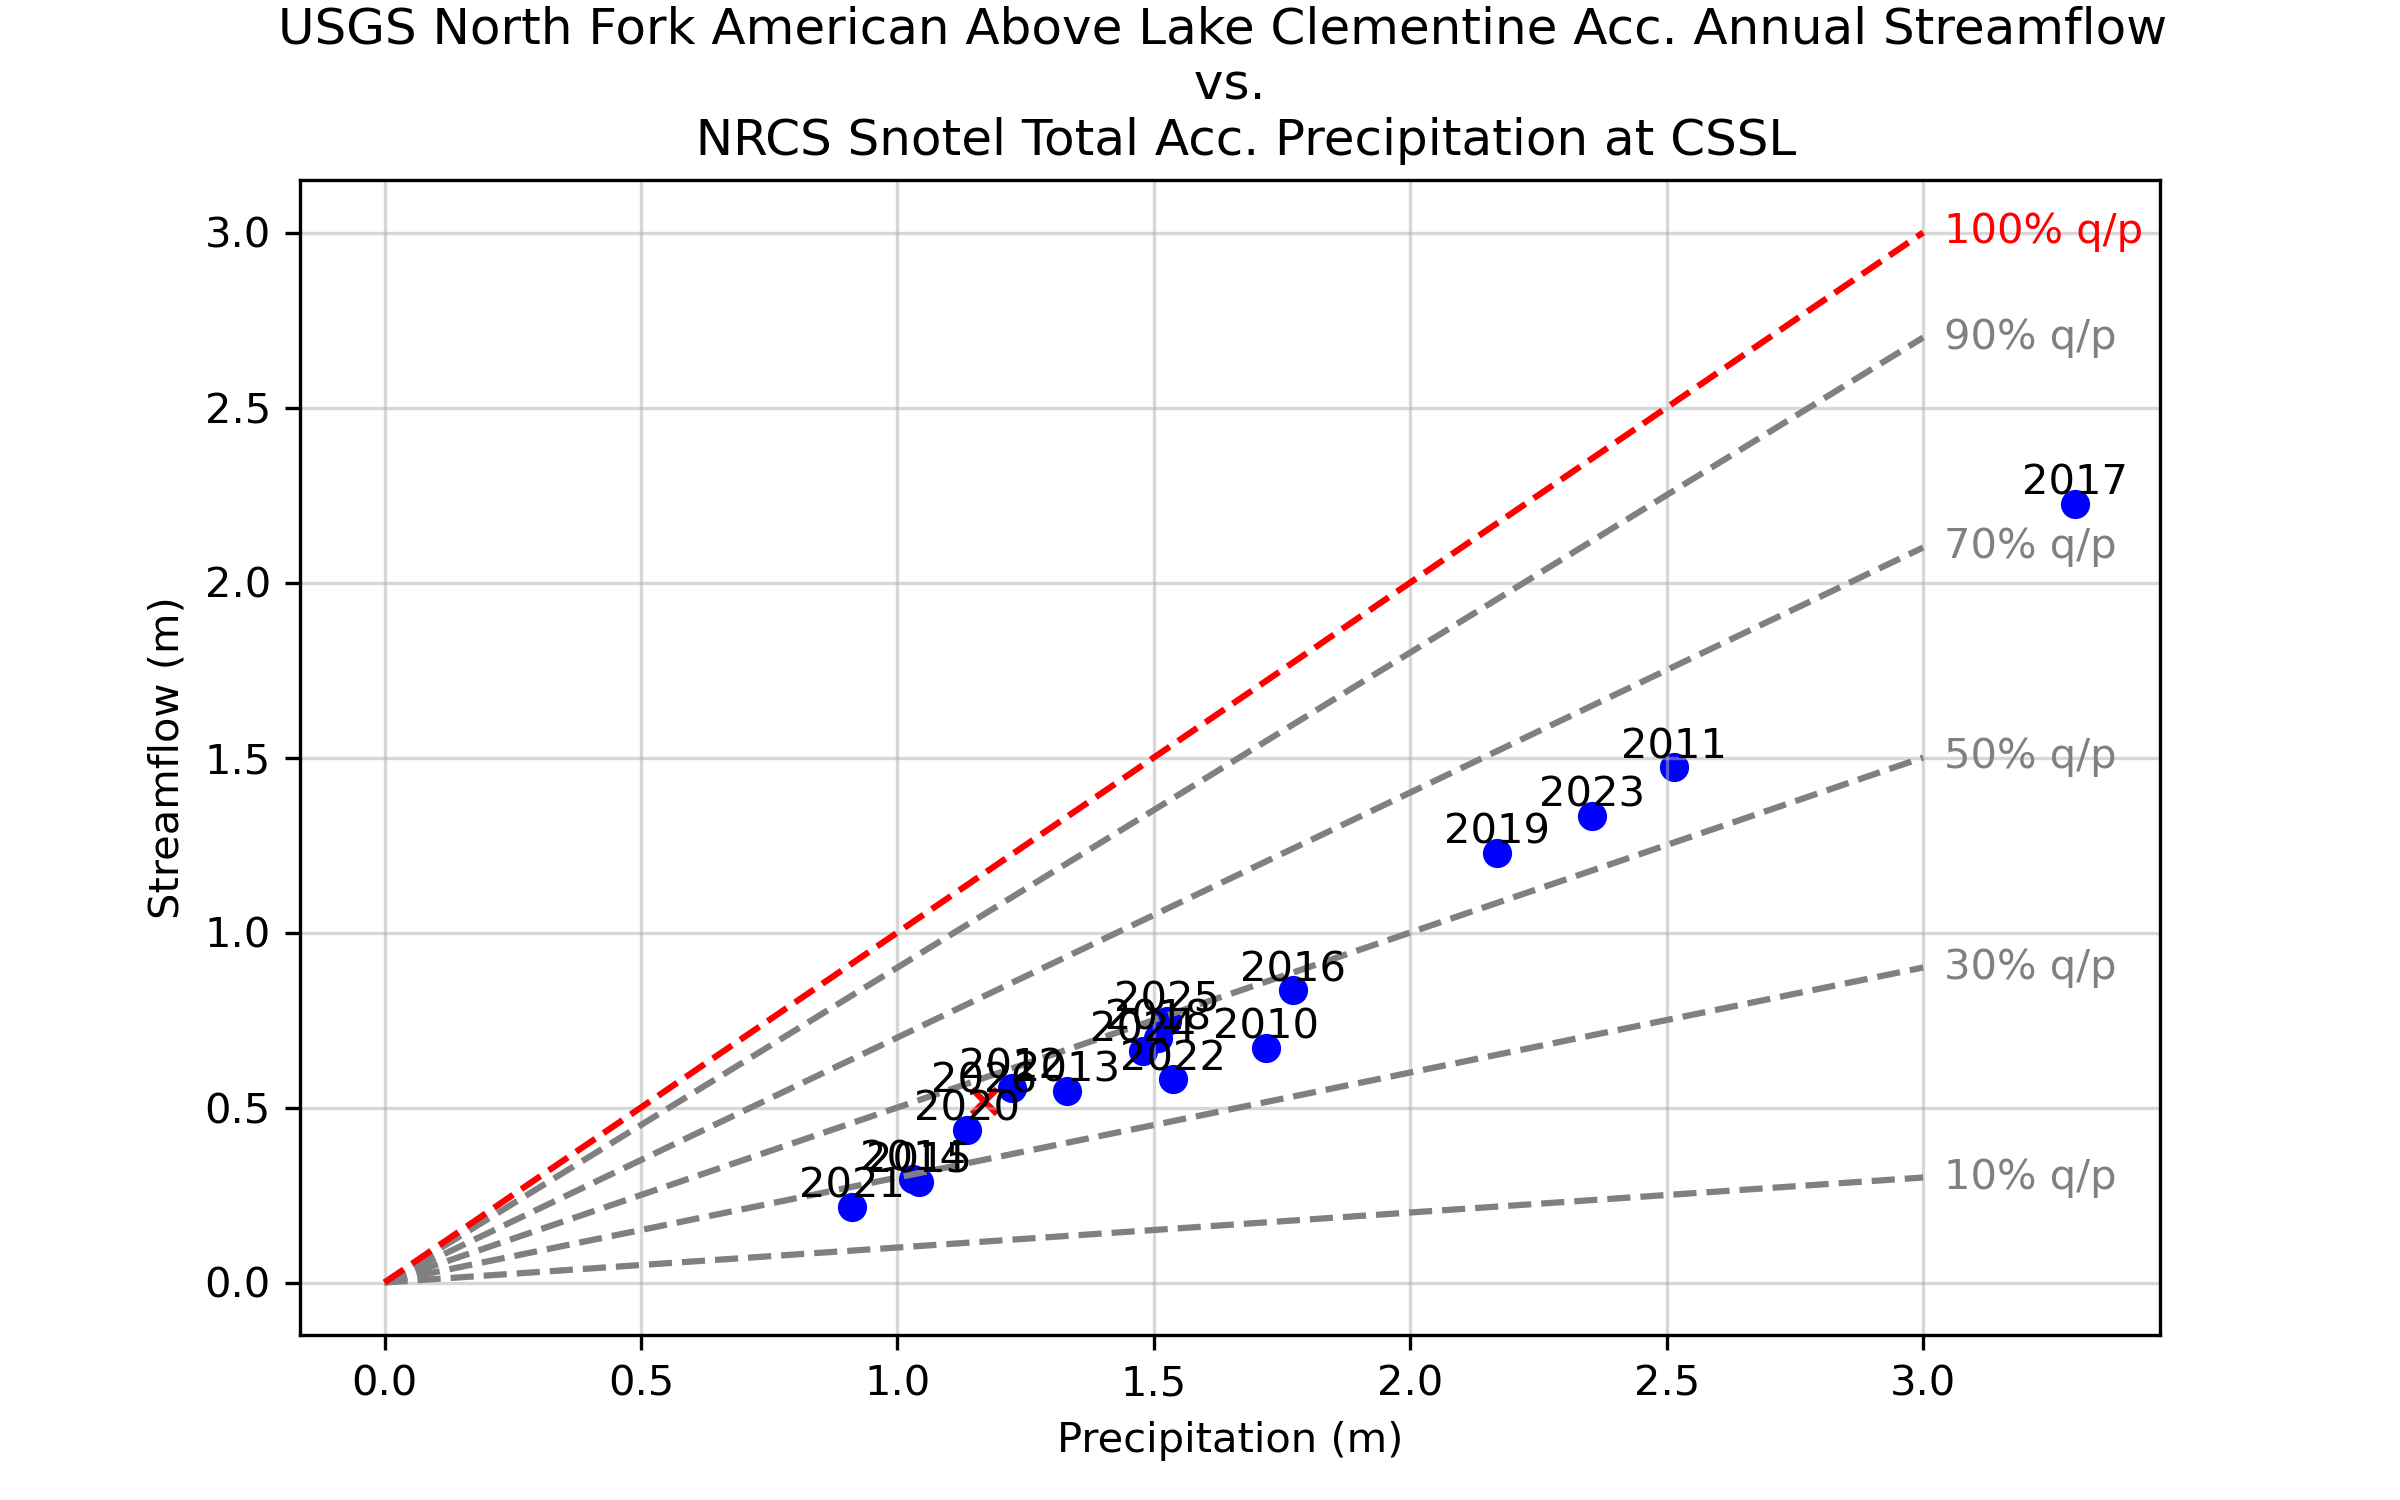
We see that there is an incredibly linear relationship between total annual precipitation and total annual streamflow. Other watersheds might not have quite so linear of a relationship (particularly regions with summer rain—which is largely absent in CA). Note that this is total precipitation; there is no differentiation between rain and snowfall (in fact the NRCS precipitation buckets don’t really have a way of distinguishing the difference, they just measure the total amount of liquid. This is in contrast to the ‘snow pillow’ data, which records the weight of the snowpack).
But, the slope of an imagined regression line going through the data points does not intersect the x-axis at 0—in other words, not all years have a constant “precipitation efficiency” (depicted as gray dashed lines), which is the ratio of streamflow to precipitation.
And it’s quite a large spread. Years with low precipitation tend to have a low precipitation efficiency (~30%) whereas years with high precipitation tend to have higher efficiencies (~70%).
This is better visualized this way:
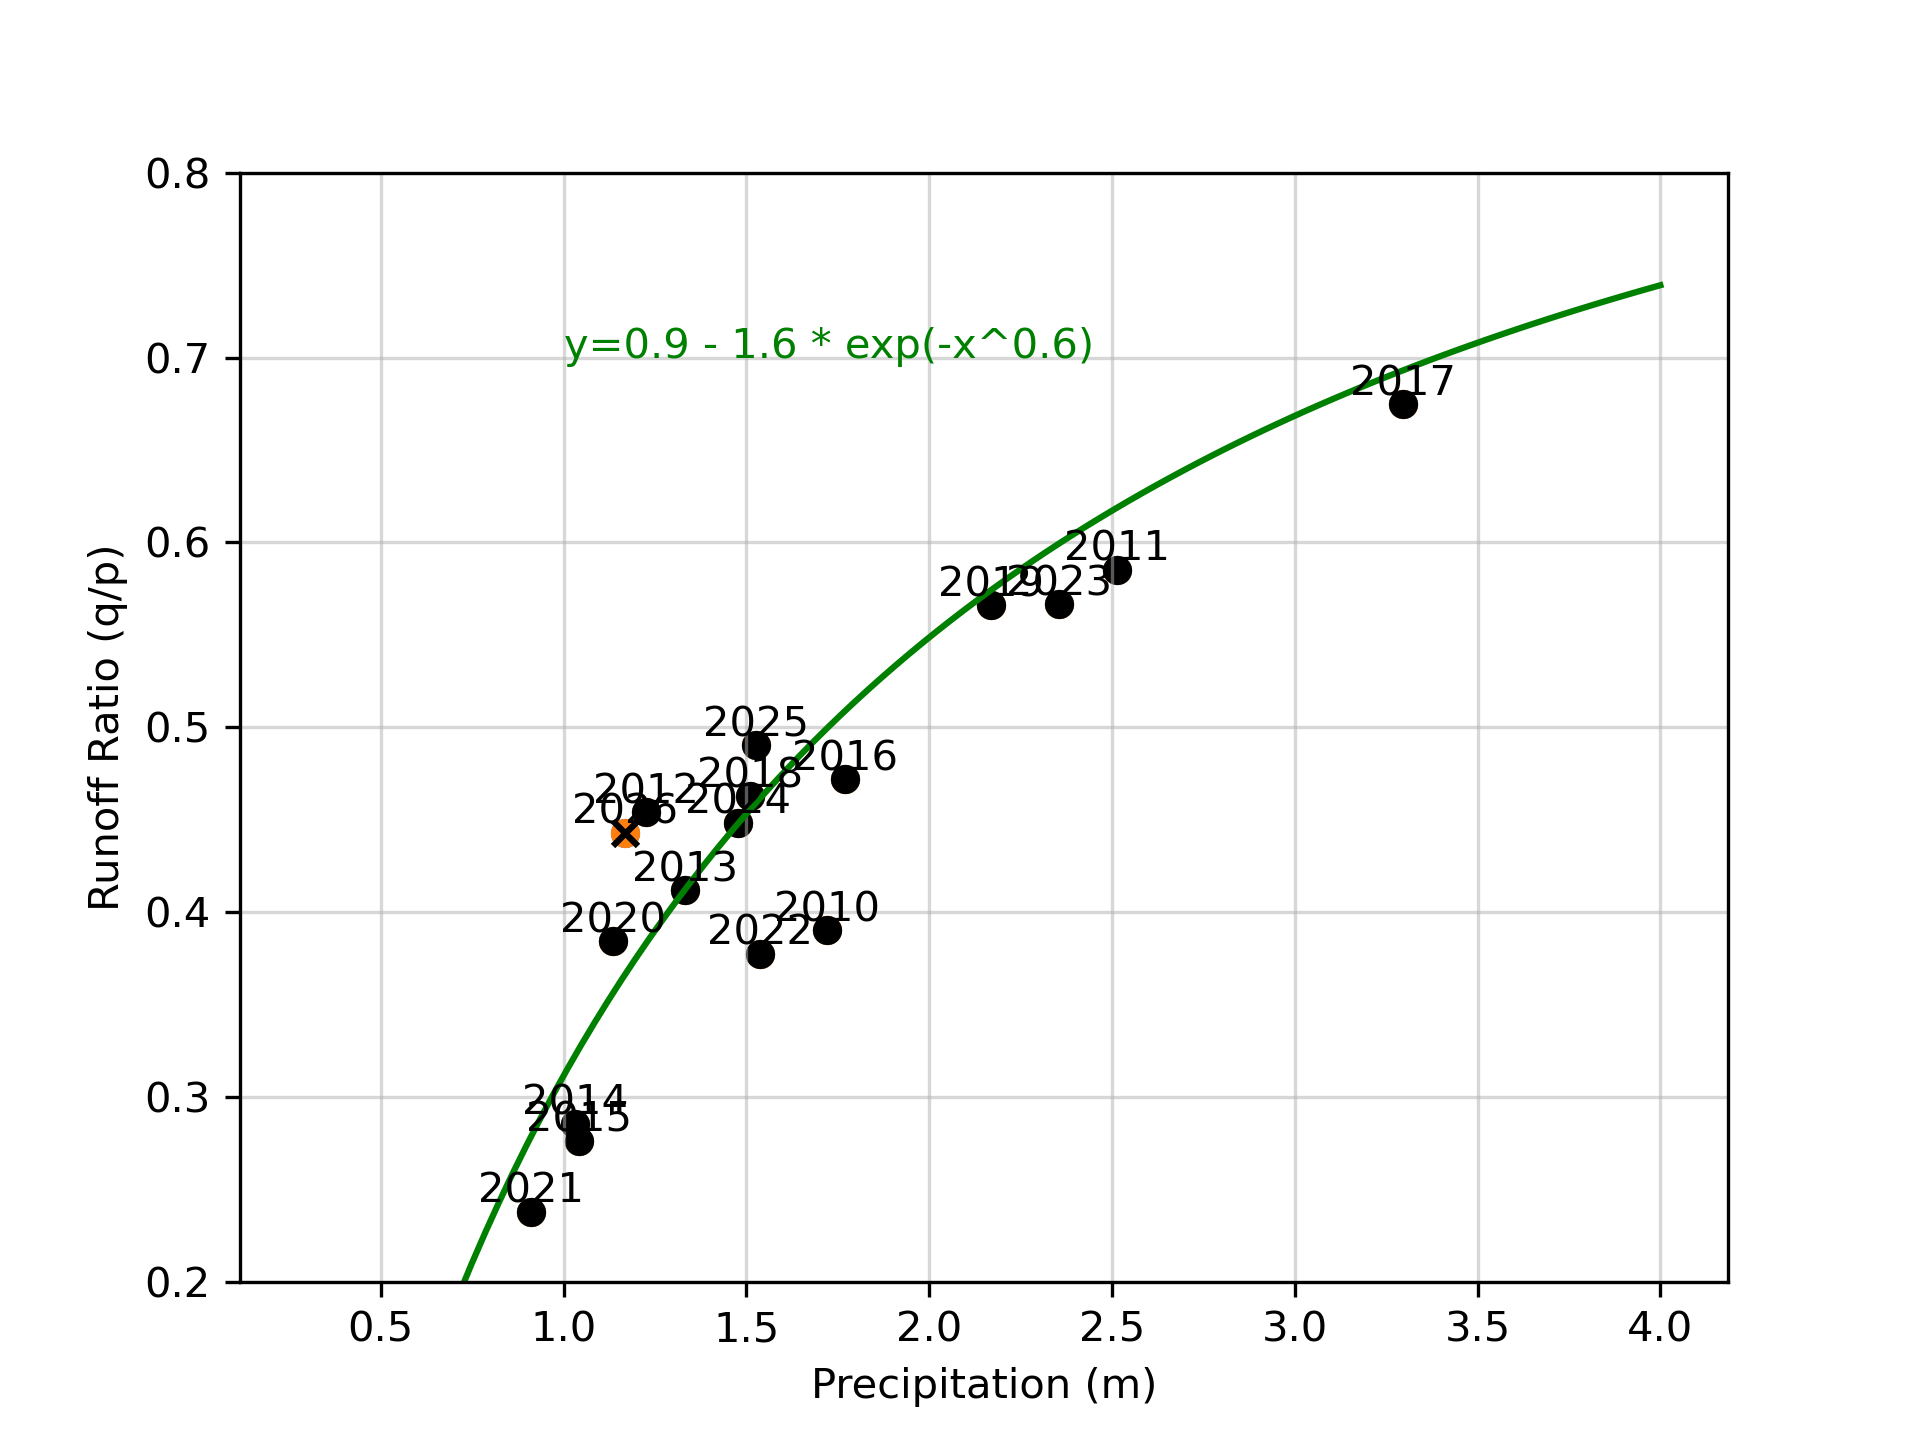
An exponential decay curve fits the data fairly well.
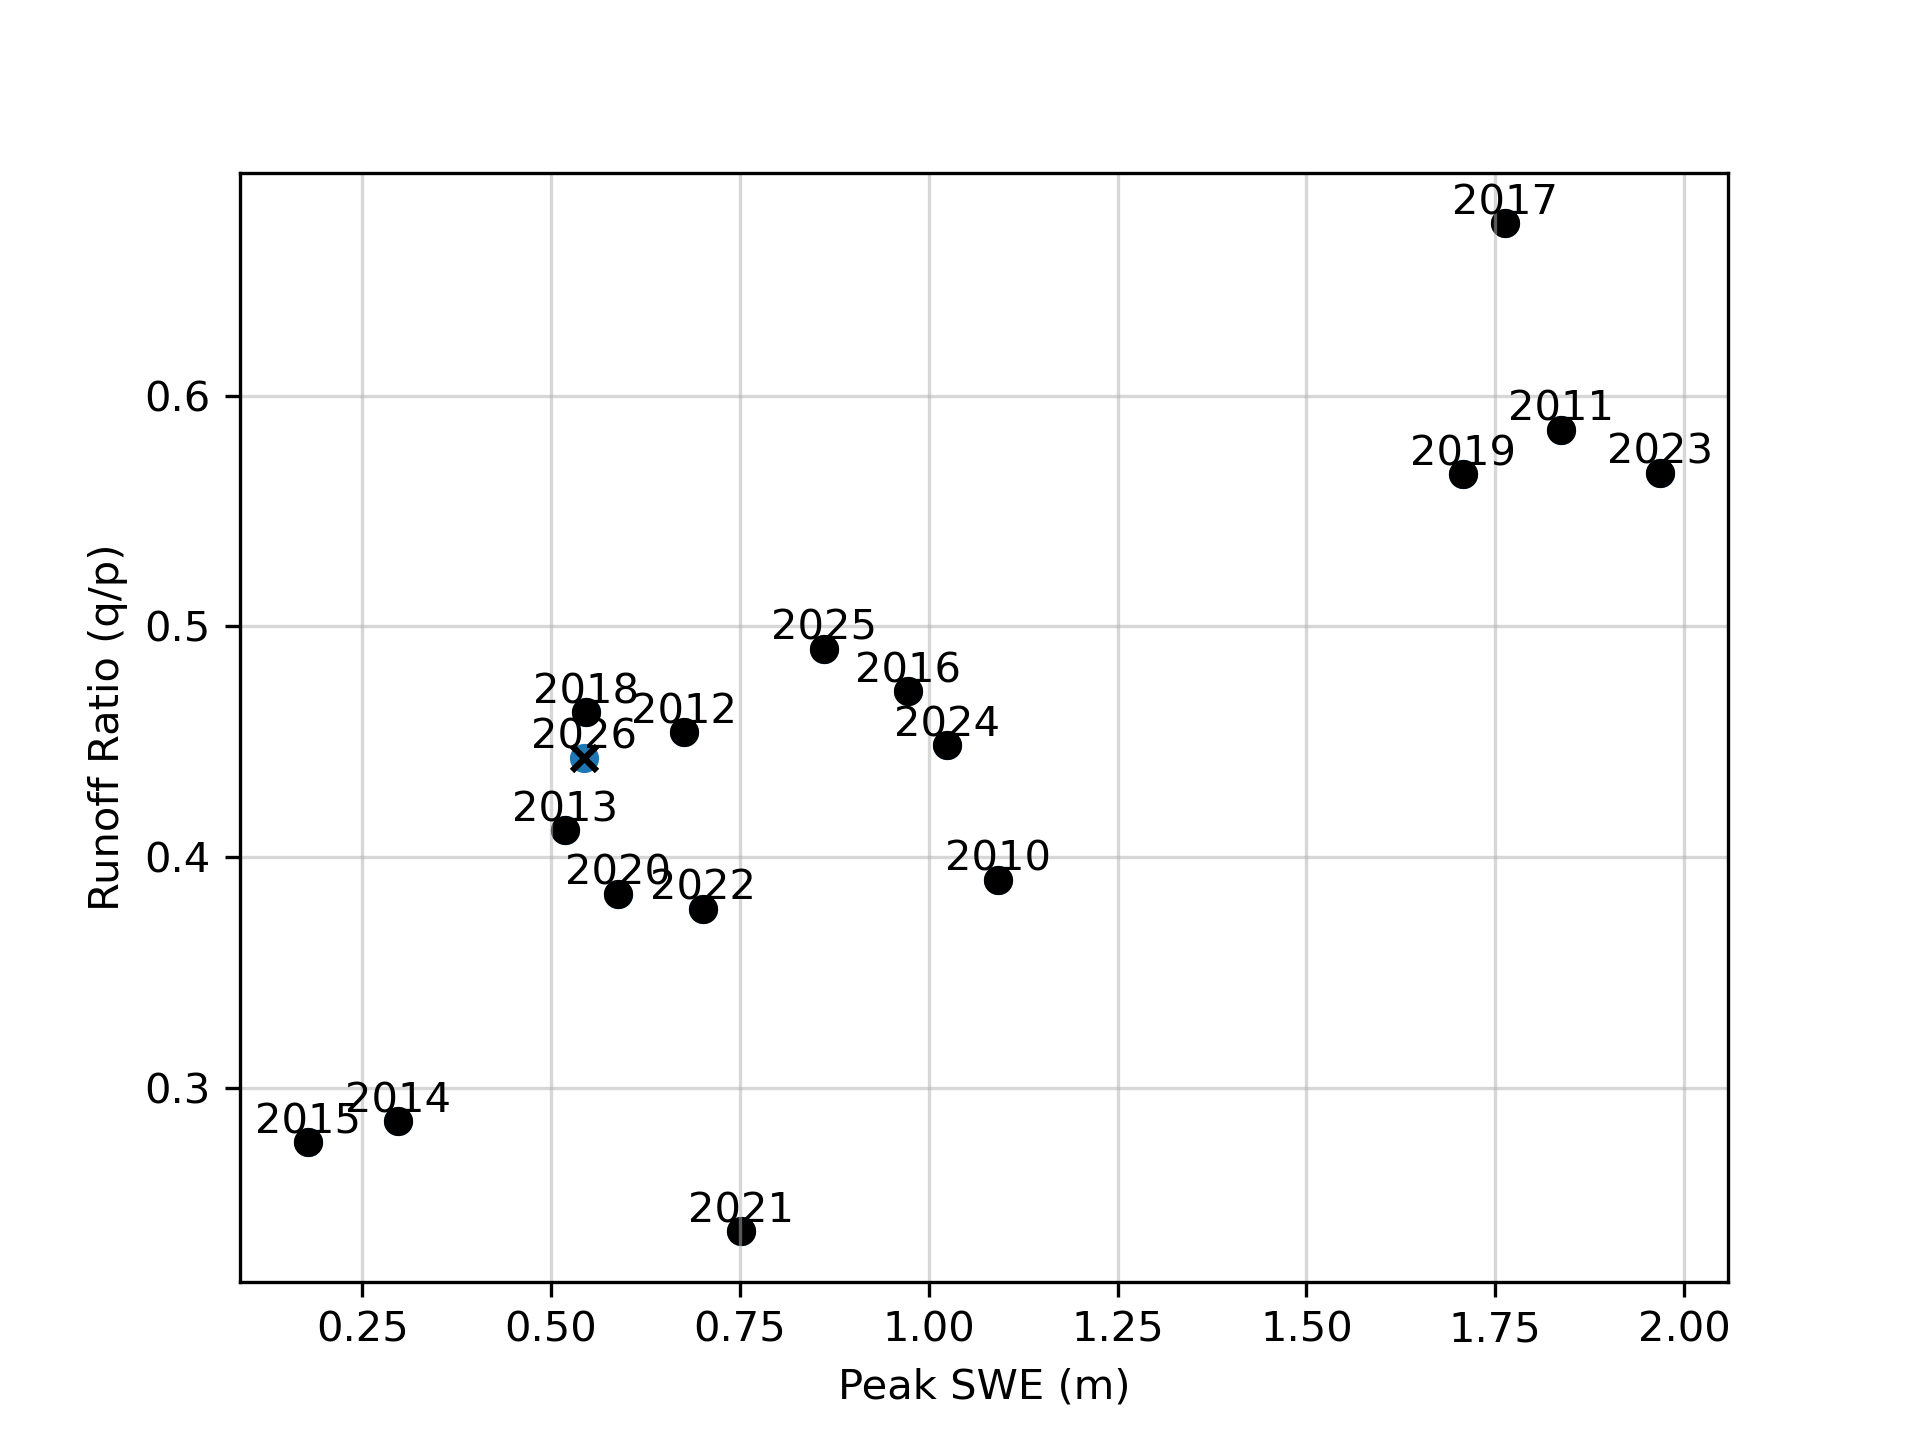
Qualitatively speaking the relationship between peak SWE and runoff efficiency is not quite as strong as precipitation alone:
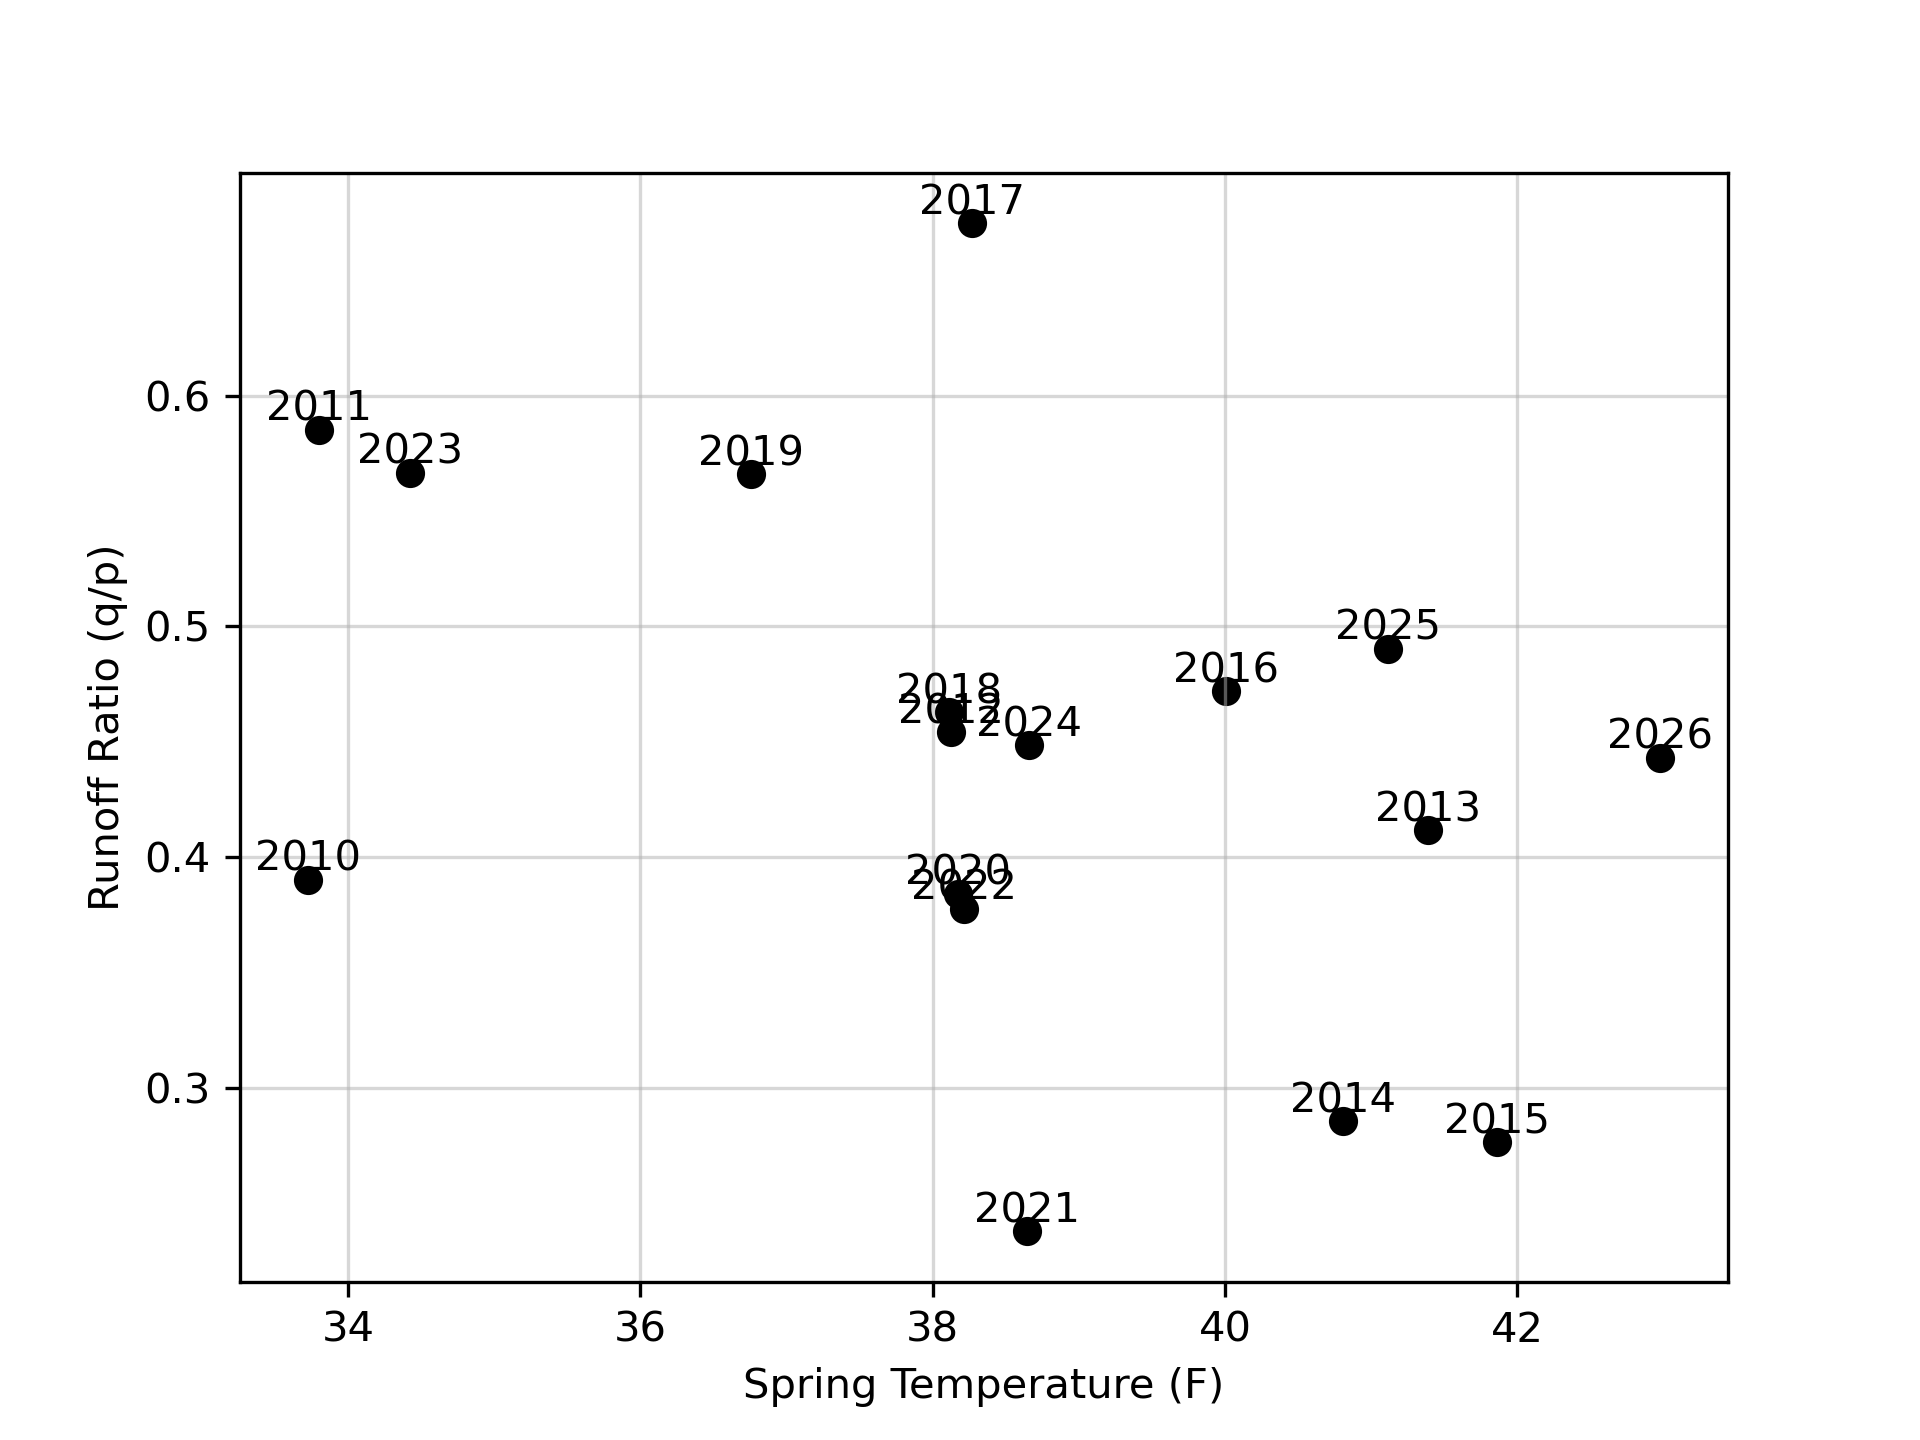
We can also compare runoff efficiency against the average Spring air temperature. Note that 2026 is the warmest examined. There is likely a relationship (lower efficiencies are associated with warmer temperatures). Whether this is an ET-driven phenomenon, or related to the covariance with precipitation, remains to be seen.
Conclusions
The warm temperatures and low snowpack of 2026 are harbingers of years to come, and studying them provides clues about the future of the hydrologic cycle. This post just looked at one paired snow monitoring station and stream gage, which happen to have an incredibly good correlation.
When discussing the implications of runoff and earlier melt in the Sierras, it’s important to keep in mind a basic fact: the annual amount of streamflow is incredibly dependent on total precipitation (in whatever form, rain or snow). Temperature-driven effects on things like ET and snow sublimation are almost certainly second-order effects. Keep in mind, we have not finished the runoff season for 2026, so it is possible the final runoff ratio may prove more anomalous than it appears now.